Why do coding agents fail? Find out from 1,000 real runs.
Load SWE-agent trajectories from the public nebius/SWE-agent-trajectories dataset into TraceHarness, then measure, replay and
explain the failures. Every number leads down to the recorded step behind it.
About 30 minutesRuns in your browserNo API keyData: CC BY 4.0
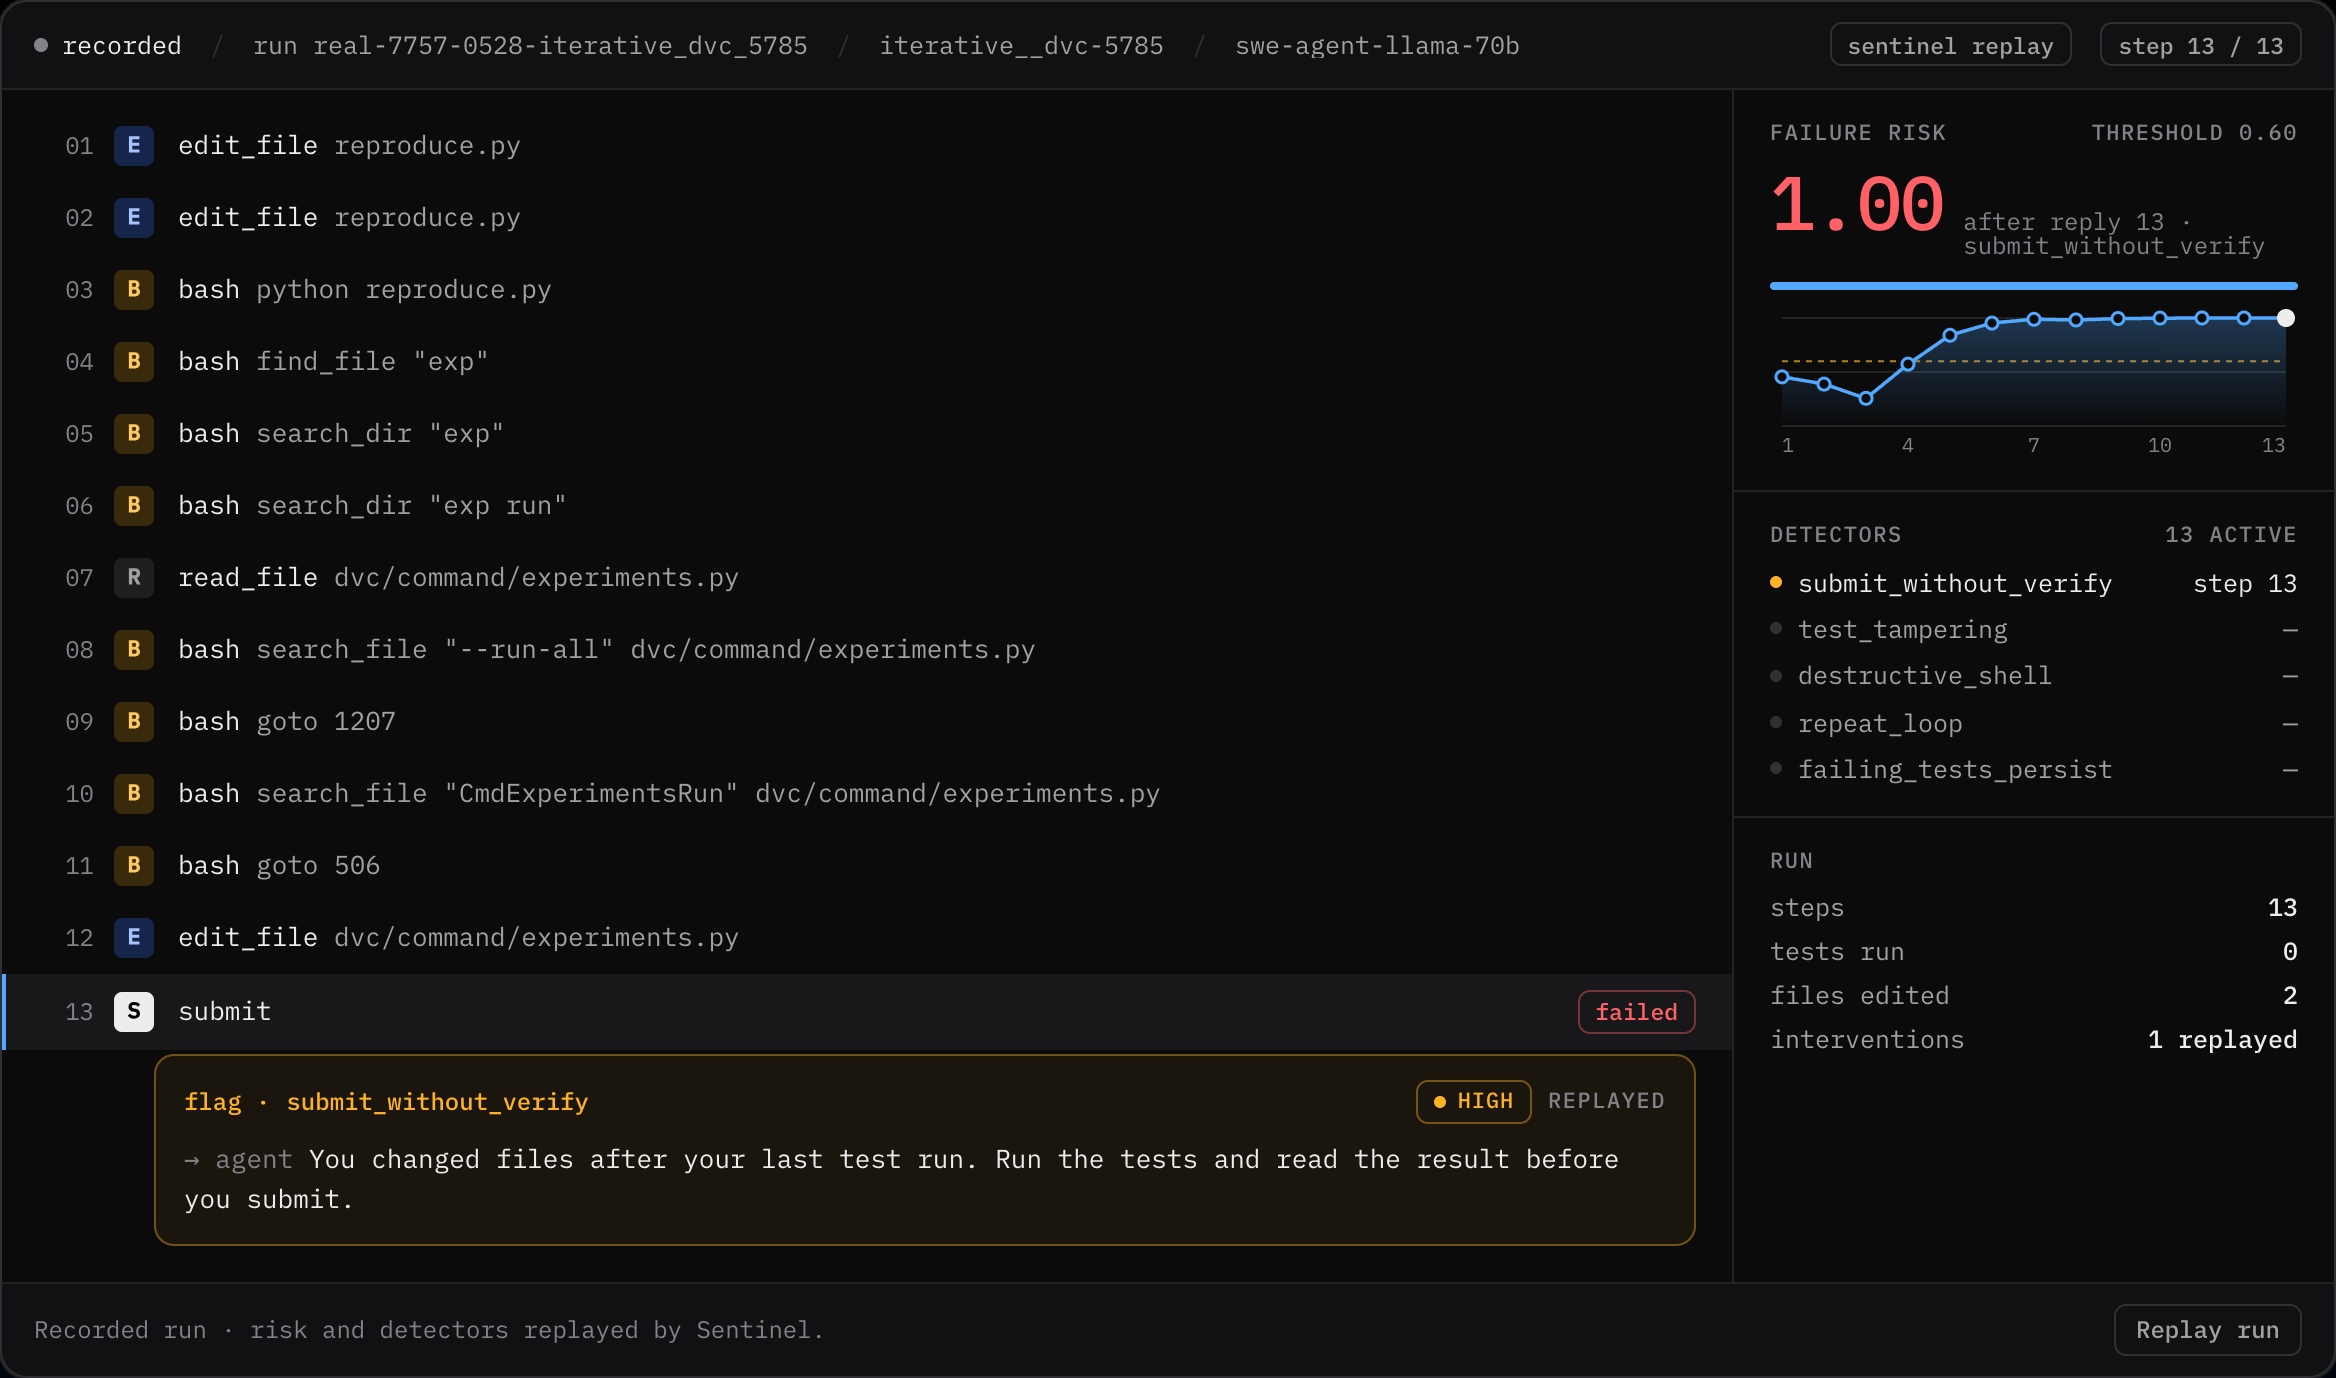
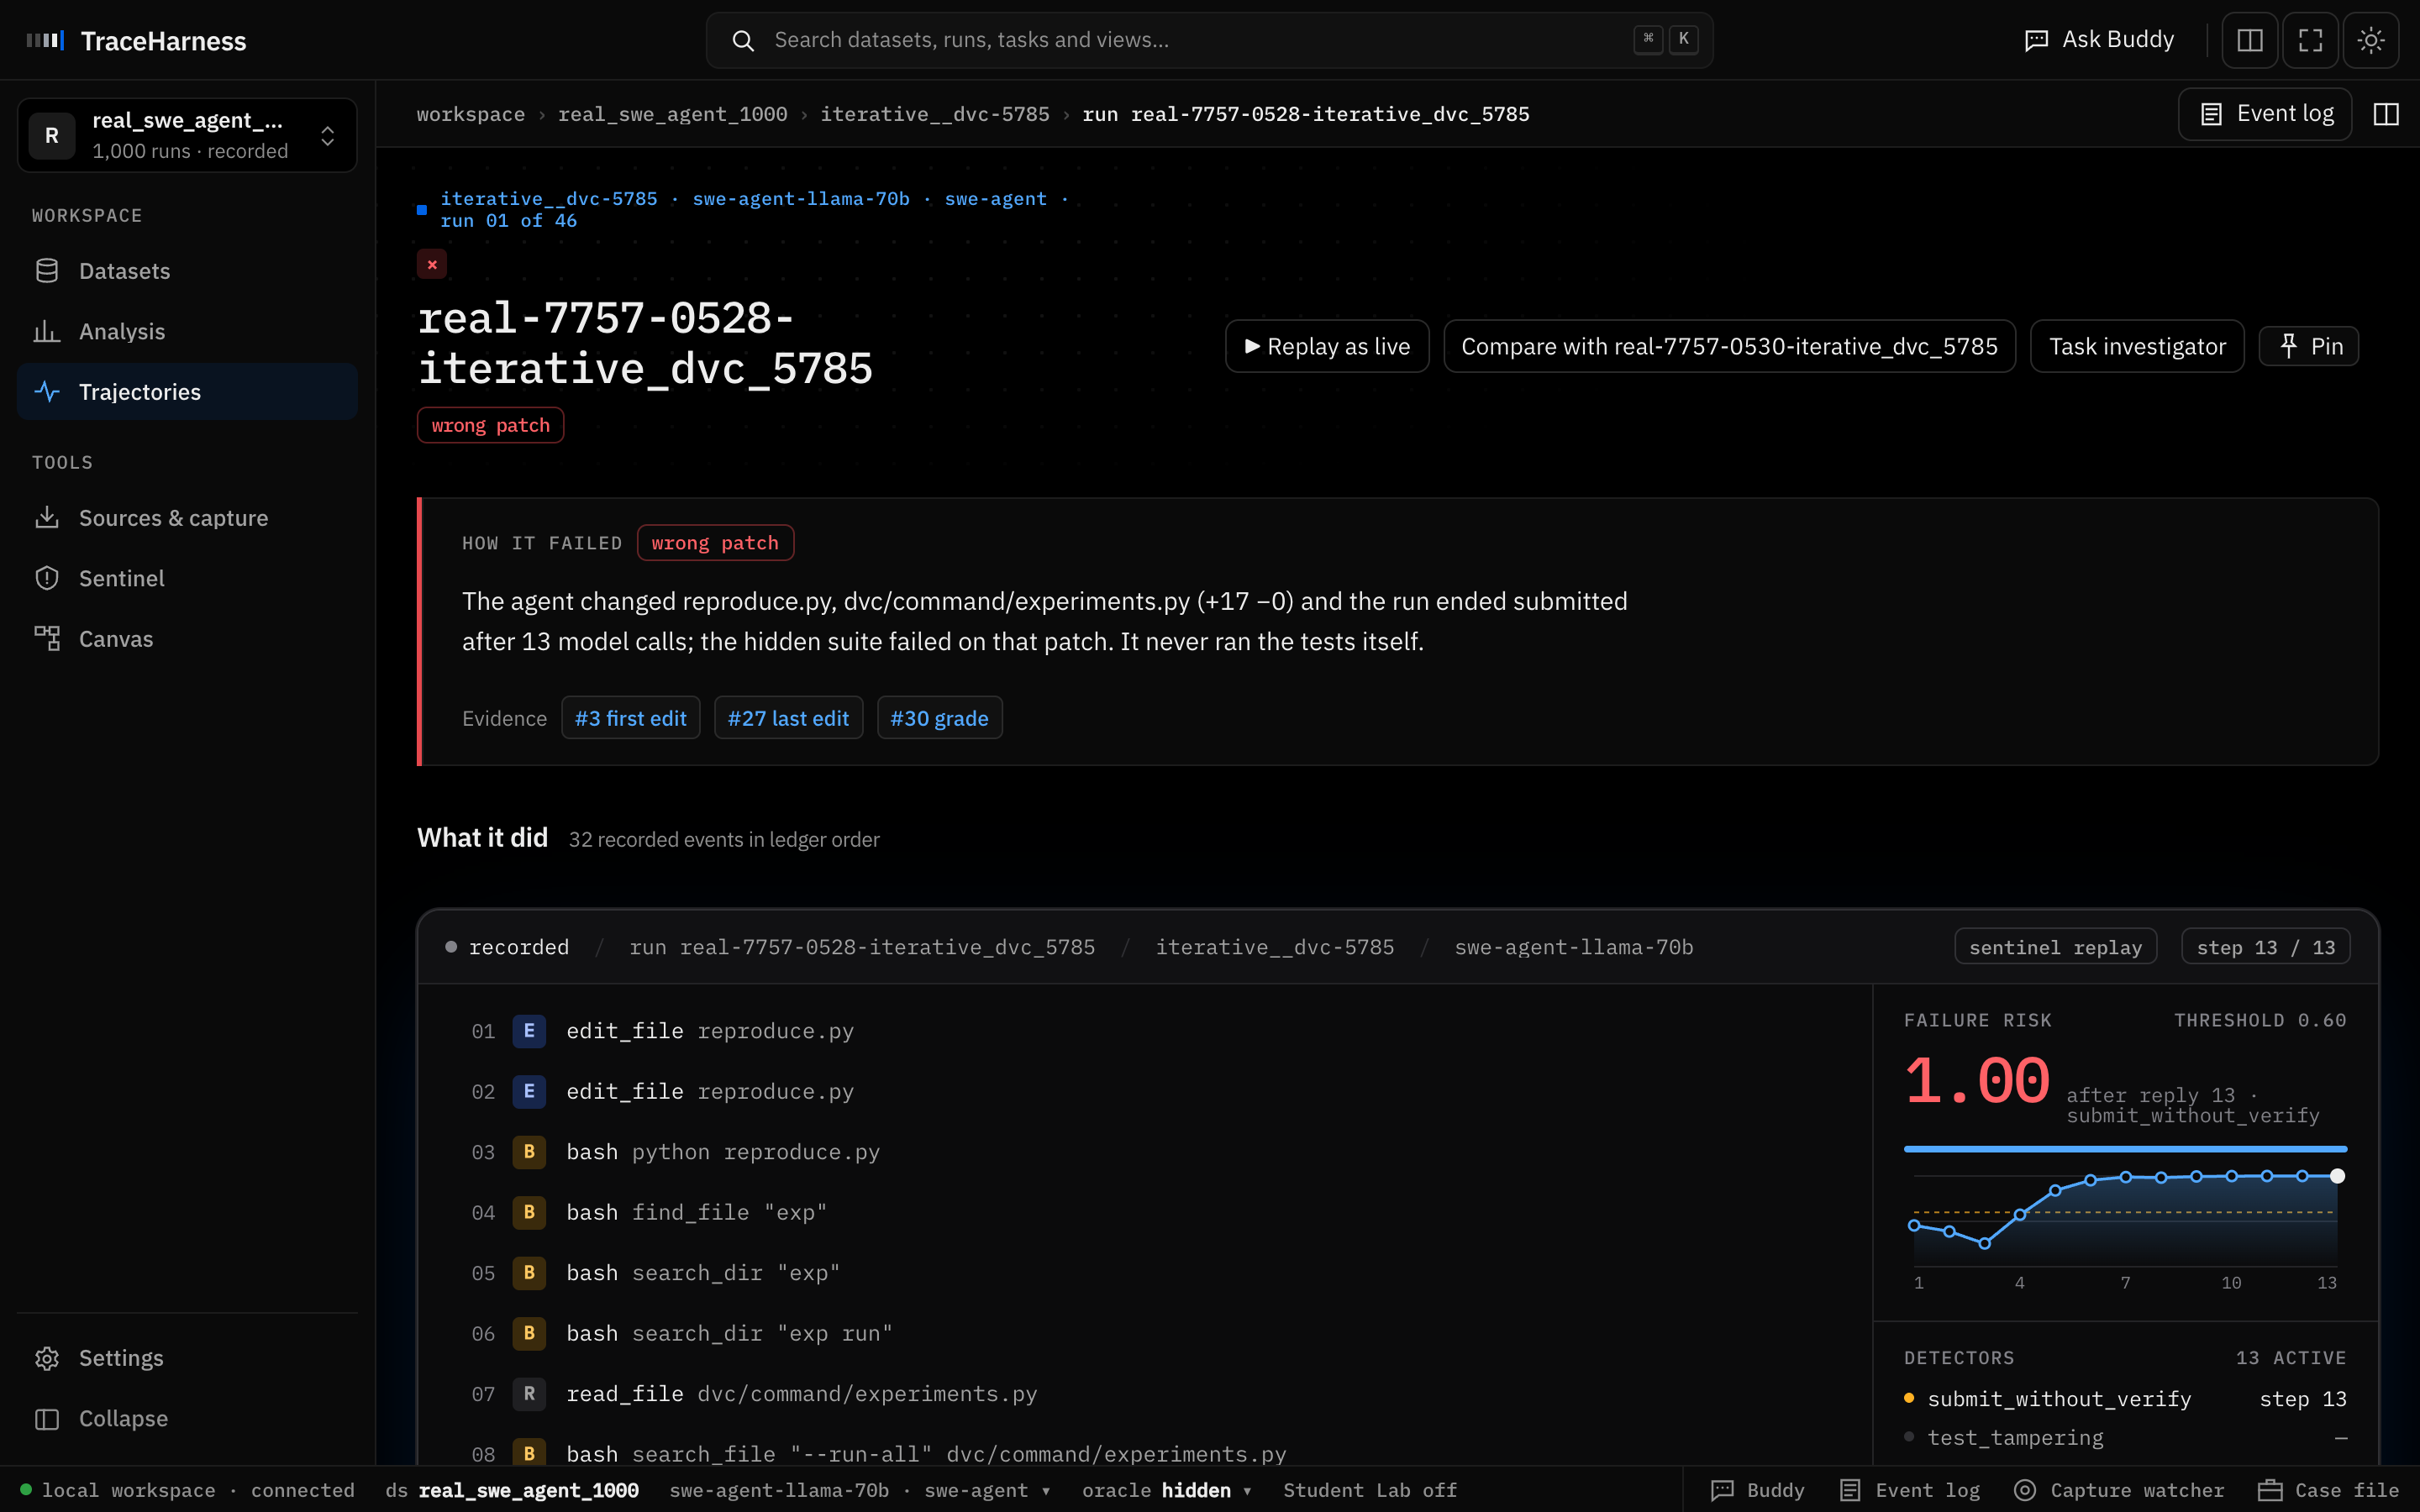
A failed run replayed in TraceHarness. Sentinel flags the submit that was never tested.
Before you start
What you need, what you will do
You need
TraceHarness, open in your browser.
A network connection for one 85 MB download from Hugging Face.
No API key: every run here is already recorded.
You will
Load 1,000 real agent trajectories from Hugging Face.
Read success rates with their intervals.
Replay a failed run and see where an early warning fires.
Rank the behaviours that go with failure, and write up what you find.
Part 01 · Setup
Open TraceHarness
TraceHarness is a web app that runs next to your data and opens in your browser on port 8742. It needs no API key:
everything in this guide works on recorded trajectories.
Start the app
If TraceHarness is already running for you (a GitHub Codespace starts it and opens the tab by itself), switch to that tab.
Otherwise start it from a terminal and open http://127.0.0.1:8742:
python -m harnesslab
Not installed yet?
You need Python 3.10 or newer. From the TraceHarness source folder, install it with the real extra, which adds the reader
for Hugging Face datasets, then start it:
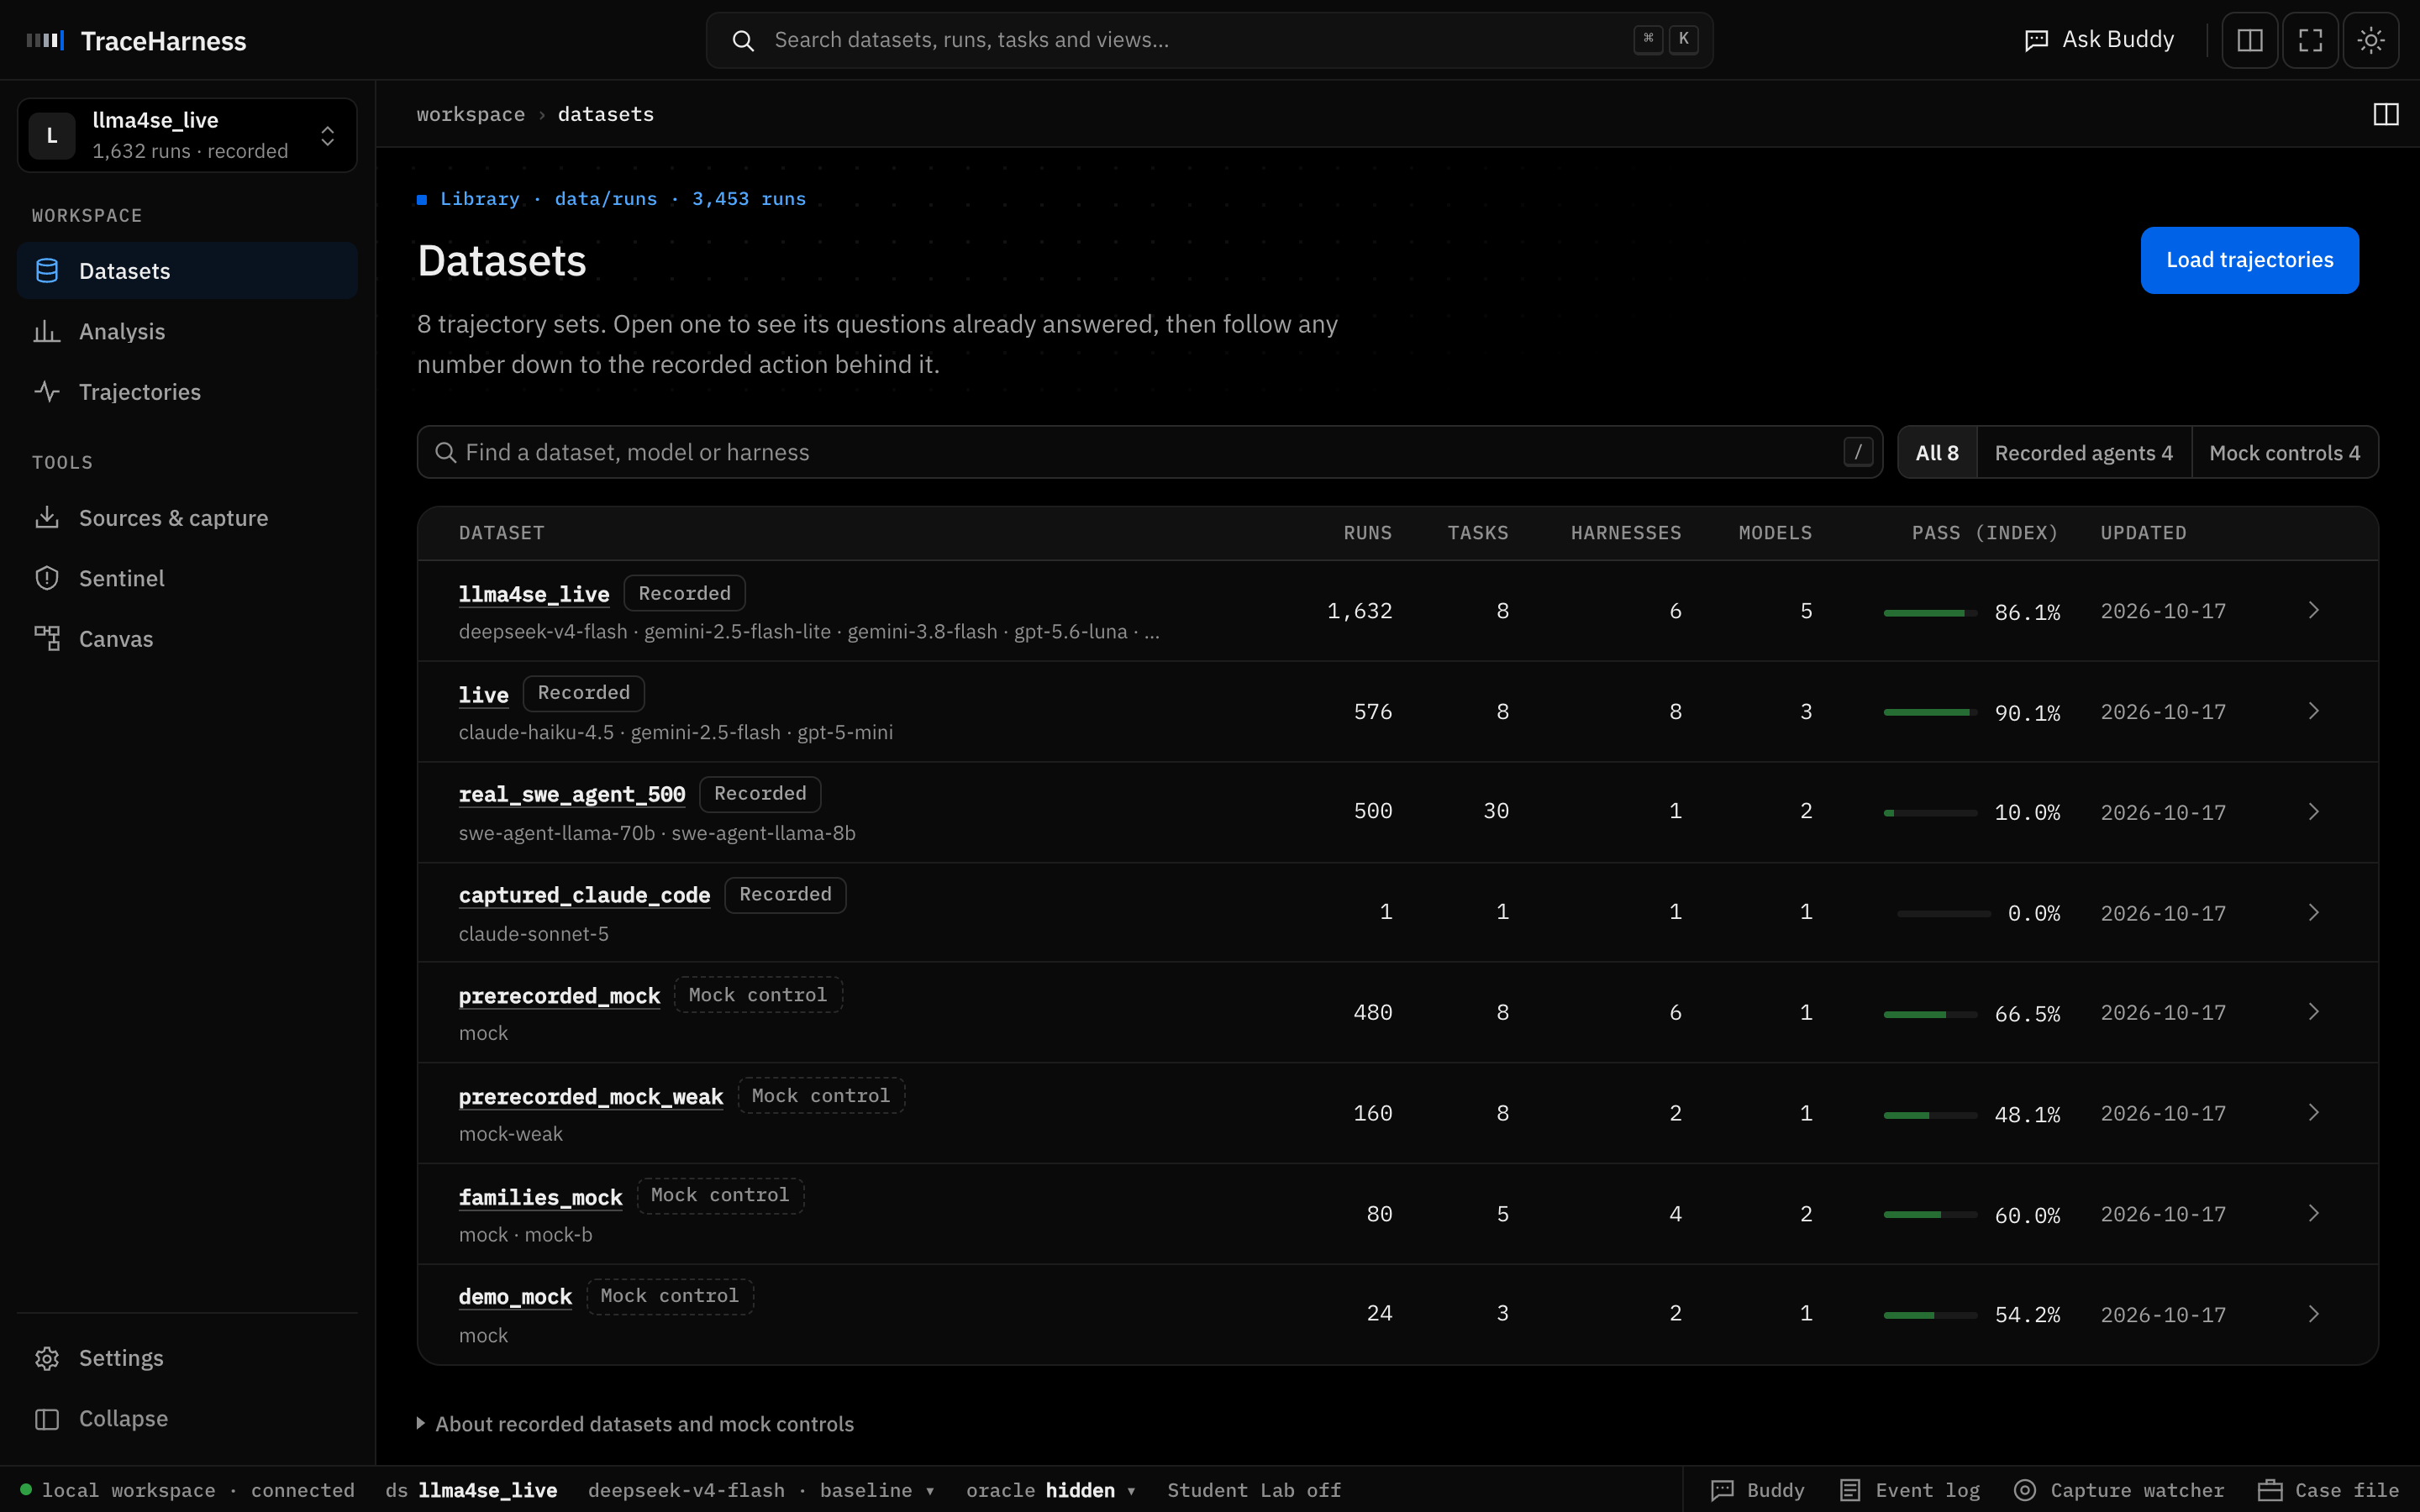
TraceHarness opens on Datasets: every trajectory set in data/runs/, recorded agents and mock controls. If
real_swe_agent_500 is listed, you already have the first 500 runs of the dataset you load next.
TraceHarness · Datasets
Datasets: four recorded agents and four mock controls. Open any of them to see its questions already answered.
Part 02 · Data
Load the reference dataset
nebius/SWE-agent-trajectories holds 80,036 runs of SWE-agent, an autonomous coding agent, on real
GitHub issues. Each run is one attempt at one issue: every thought, command and observation, the patch it submitted, and whether the
issue's own tests passed afterwards (resolved). You will load the first 1,000 runs.
Open Sources & capture
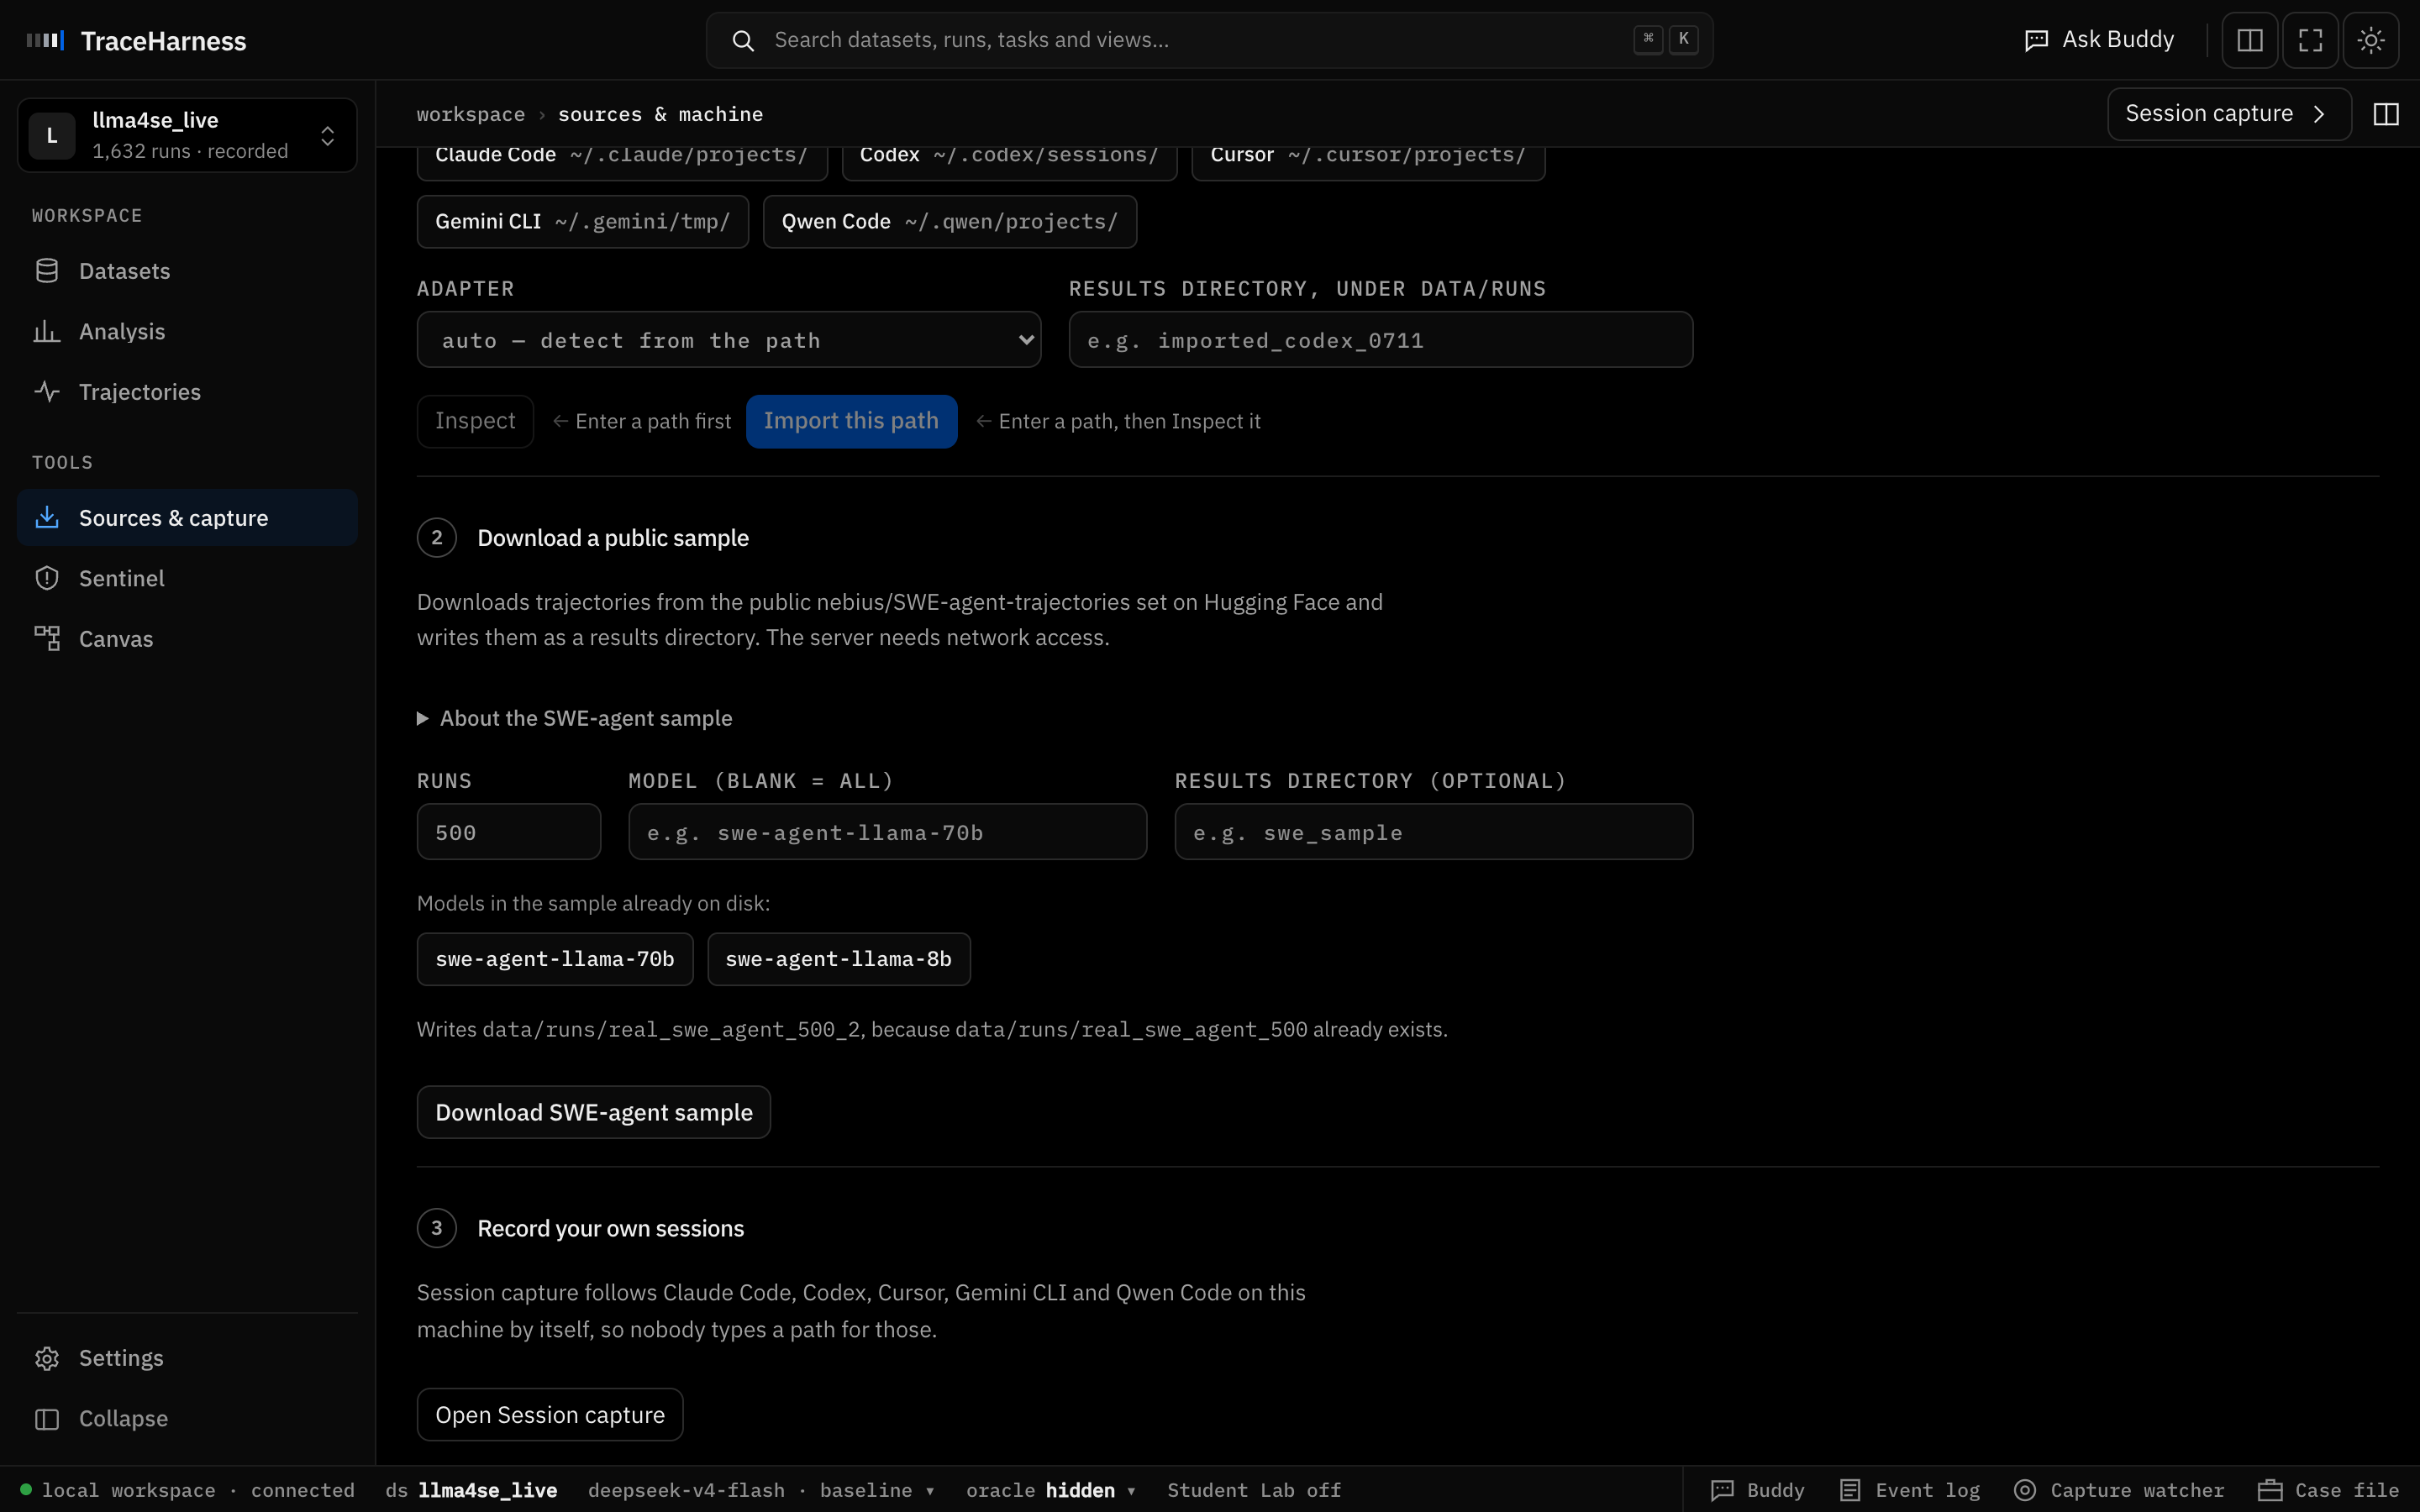
In the left rail, click Sources & capture (the Load trajectories button on Datasets opens the same page) and scroll to
2 · Download a public sample.
TraceHarness · Sources & capture
The download form, before you change anything. With the default 500 runs it would write a second copy of the bundled sample, and says so.
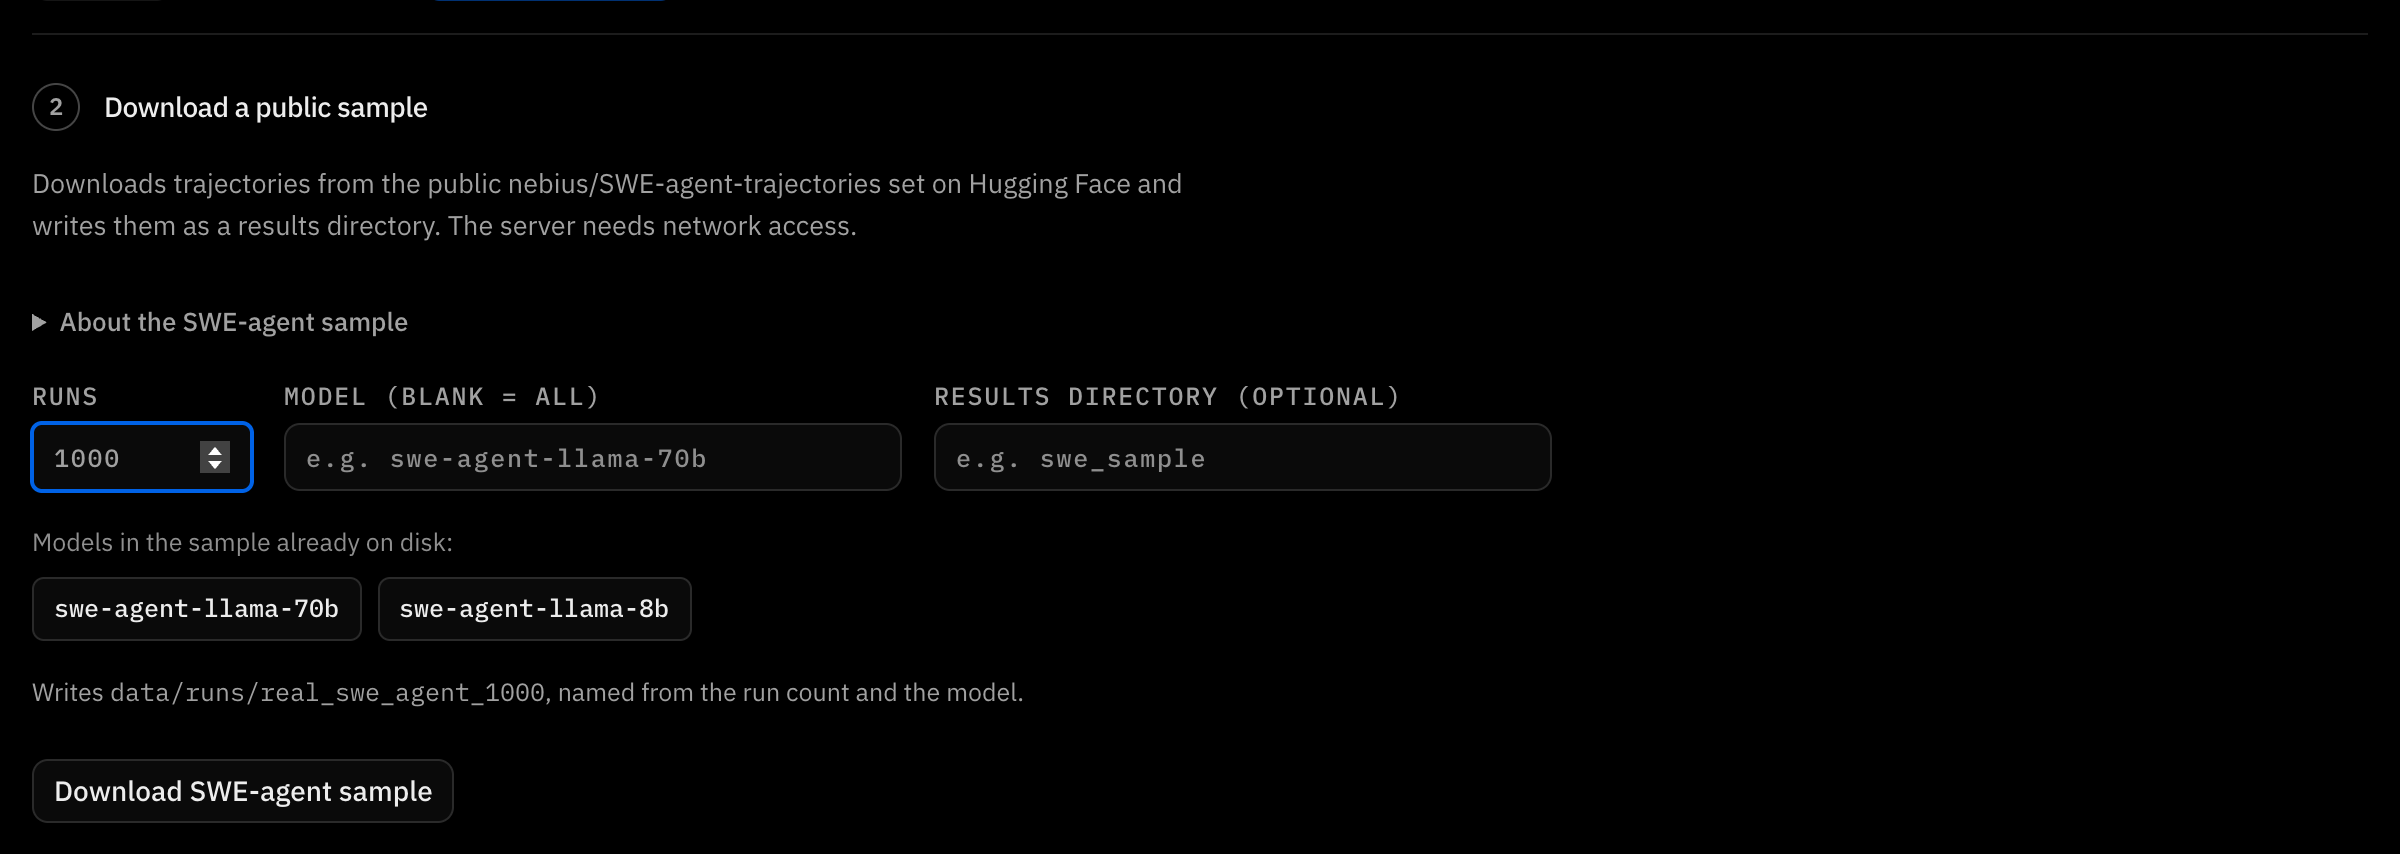
Ask for 1,000 runs
Set Runs to 1000. Leave Model and Results directory blank: the sample then keeps every model,
and it is written to data/runs/real_swe_agent_1000.
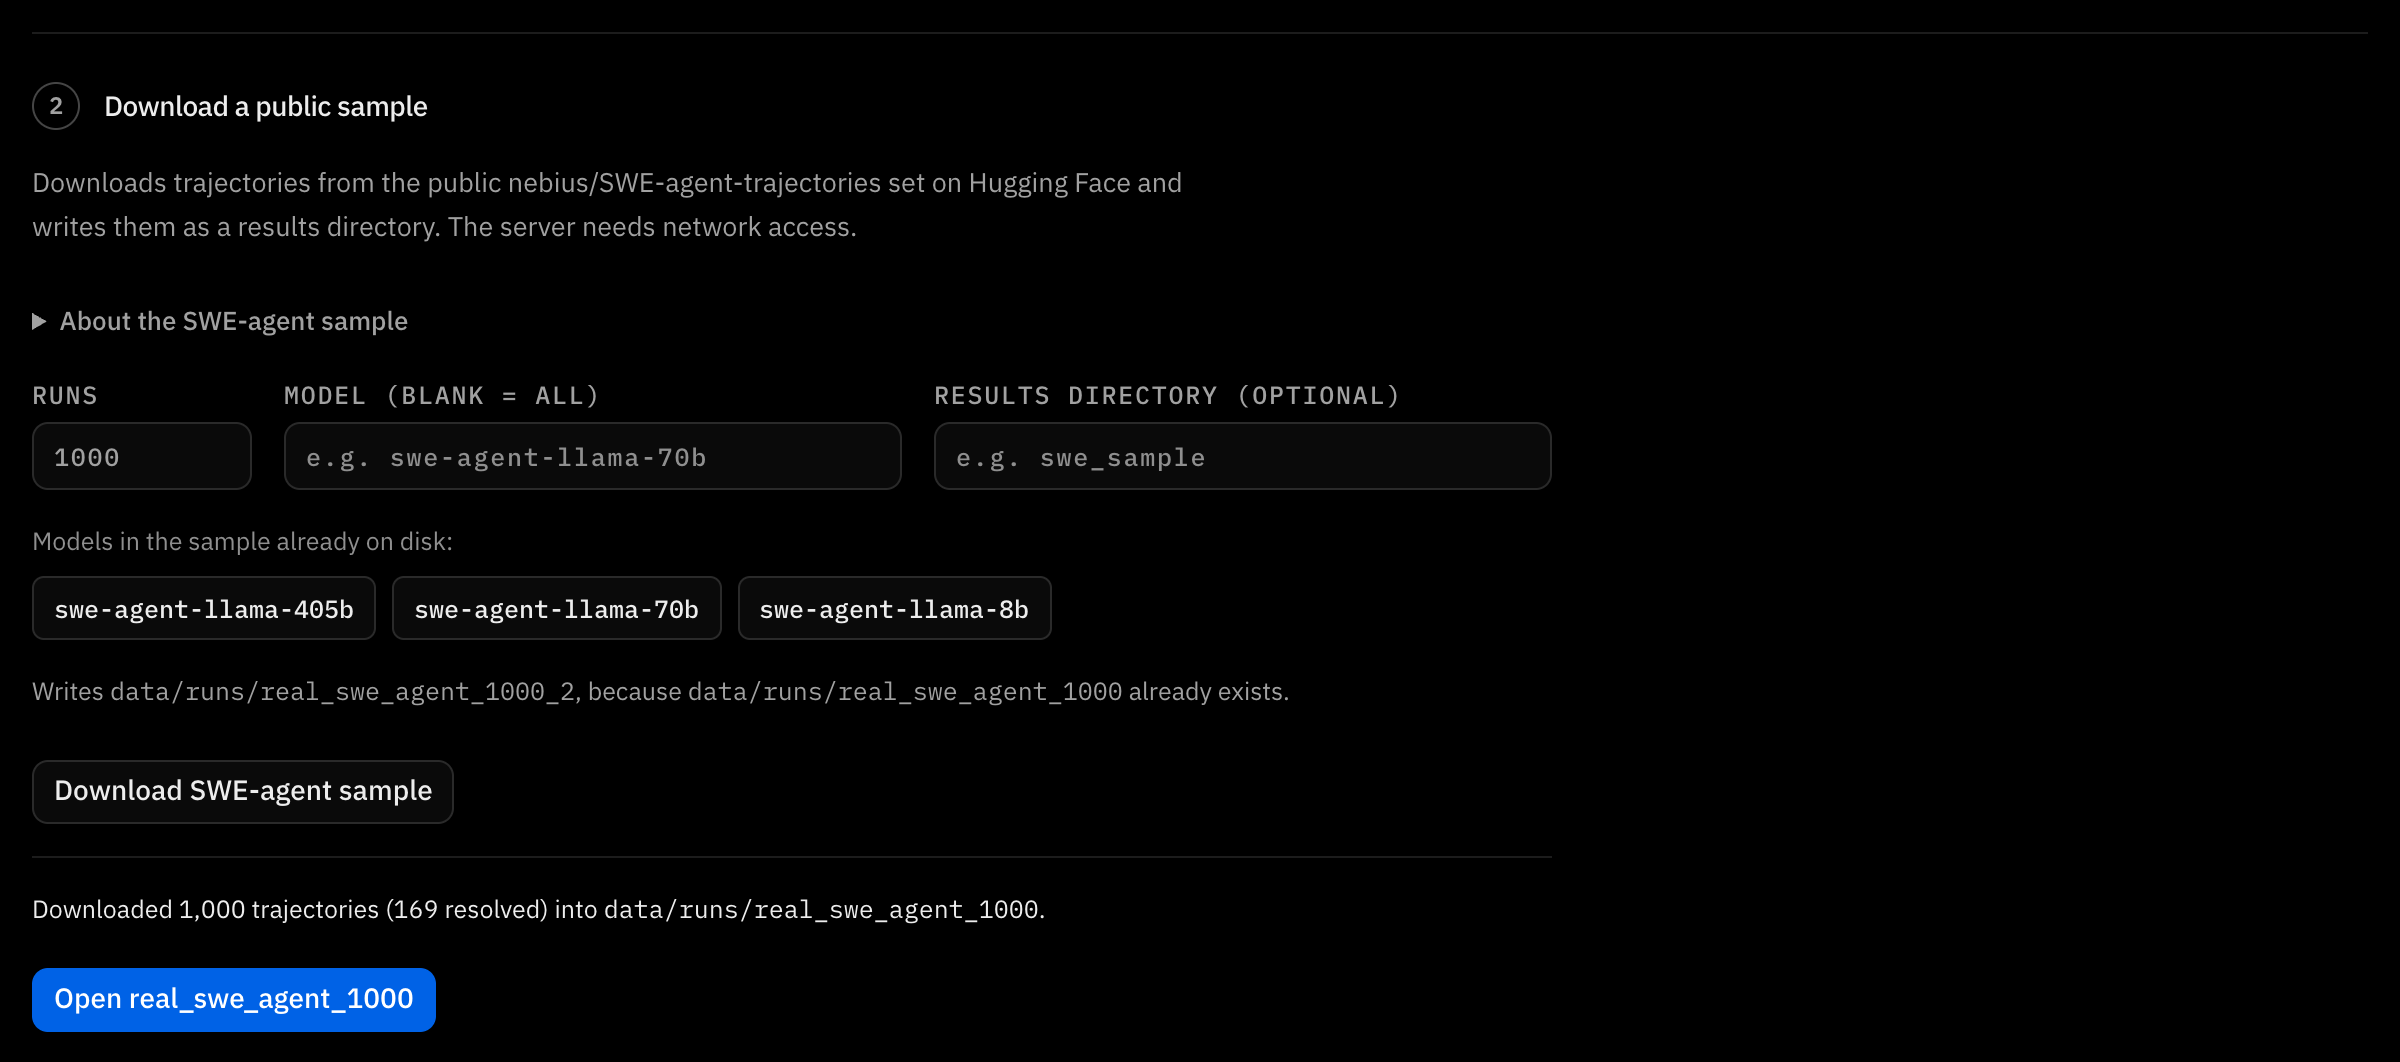
The line under the form names the directory it will write.
Download and import
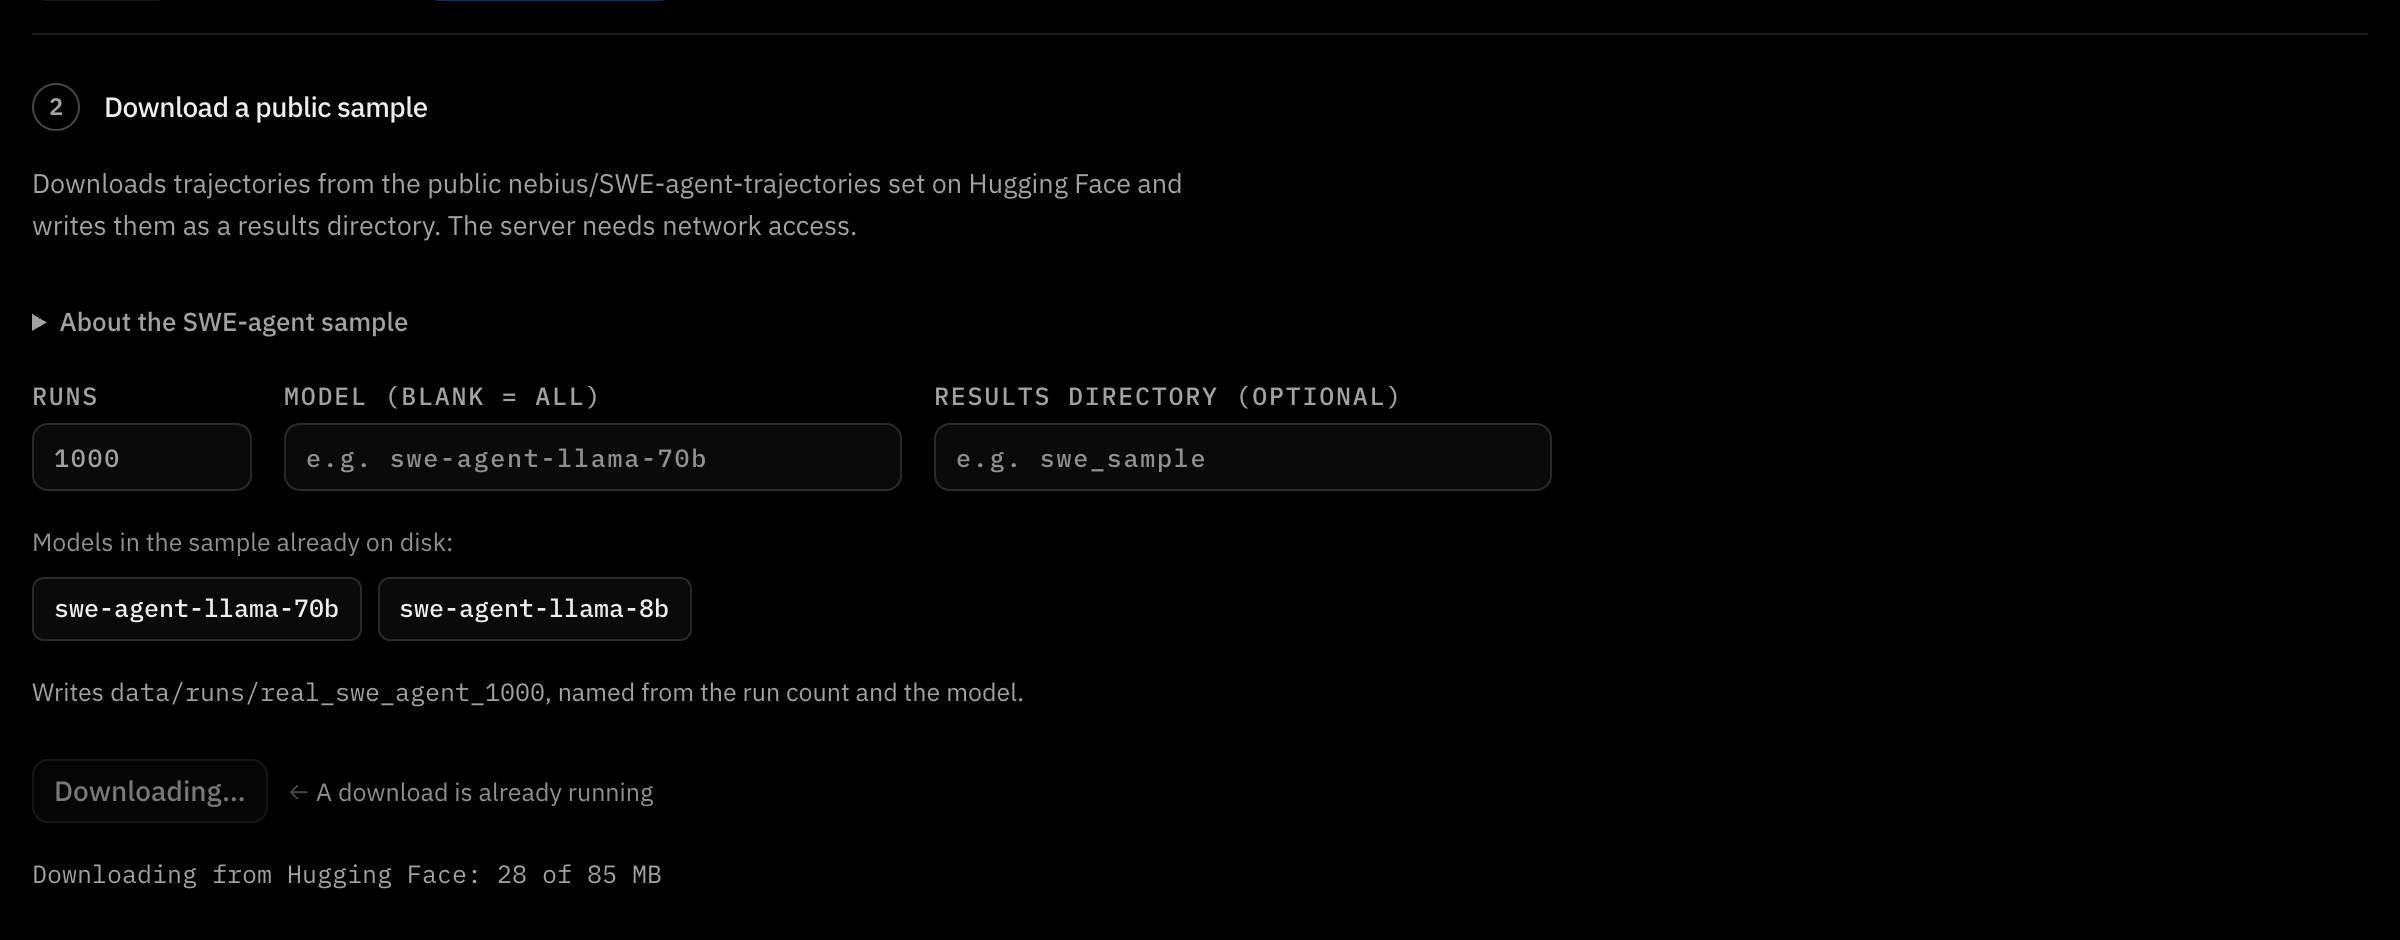
Click Download SWE-agent sample, then Download & import to confirm. The server downloads one 85 MB file from Hugging
Face, then writes the 1,000 runs. It usually takes under a minute (6 seconds in our test).
Progress first counts megabytes from Hugging Face, then the runs being written.
Open the dataset
When it finishes, click Open real_swe_agent_1000.
Done: 1,000 trajectories, 169 of them resolved.
1,000runs (trajectories)
48GitHub issues (tasks)
3SWE-agent models: Llama 8B, 70B, 405B
169resolved (16.9%)
Same numbers
The download always takes the dataset's first rows, in order. Load 1,000 runs with Model and
Results directory blank and every number in this guide is the number on your screen.
Offline?
If real_swe_agent_500 is in your Datasets, it holds the first 500 of the same runs. Every step
below works on it; only the numbers differ.
Part 03 · Analysis
Analyse the trajectories
Seven views, from the big picture down to a single step. Each one answers a question you can check against the recorded
runs.
A · Overview
Start from the questions, already answered
Where Datasets → real_swe_agent_1000 → Overview
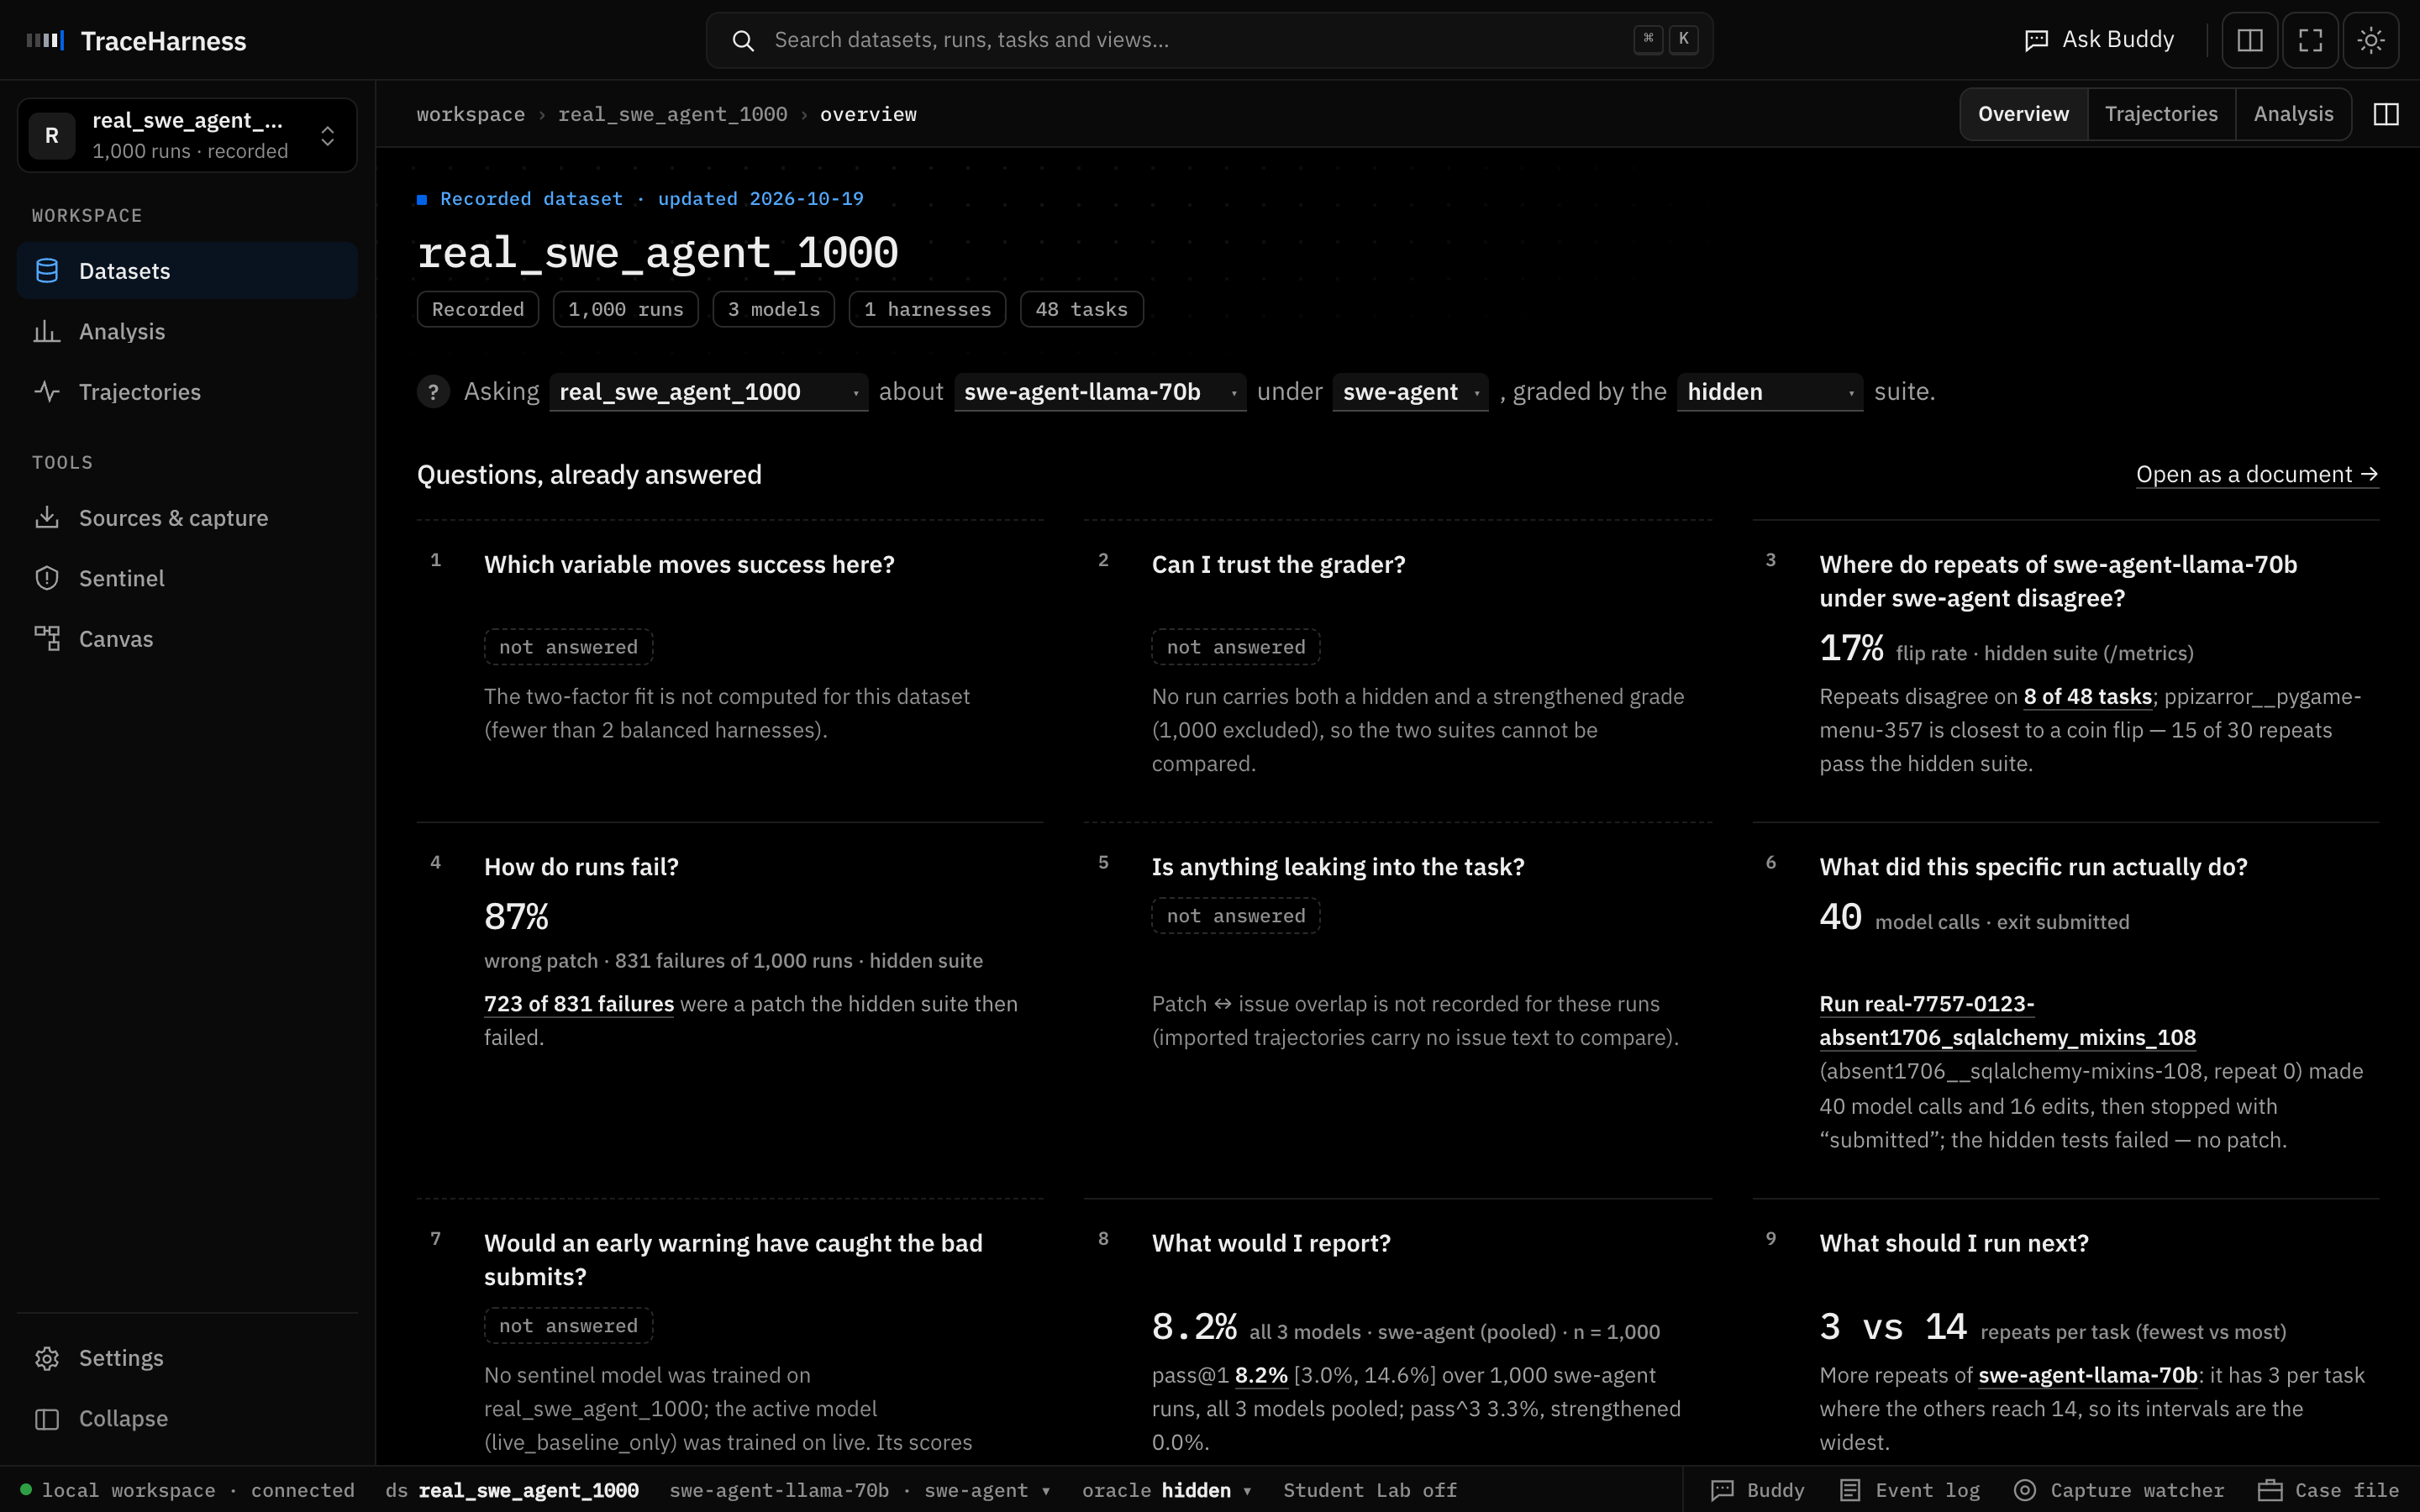
The dataset opens on nine questions answered from the recorded runs. They are asked of one condition, set by the line at the
top: Asking the dataset, about a model, under a harness, graded by a test suite. It opens on the model with the most runs,
swe-agent-llama-70b.
Start with How do runs fail?: 87% of the 831 failed runs are wrong patches. 723 runs submitted a patch that the issue's tests then
rejected. Where do repeats disagree? finds 8 of the 48 issues that llama-70b both resolves and fails. Every number is a link
down to the runs behind it. A question marked not answered says why: these runs have one harness and one test suite, so
there is nothing to compare them against.
TraceHarness · real_swe_agent_1000 · Overview
The overview of real_swe_agent_1000, asked about swe-agent-llama-70b.B · Trajectory explorer
See every attempt, task by task
WhereTrajectories (top right of the dataset)
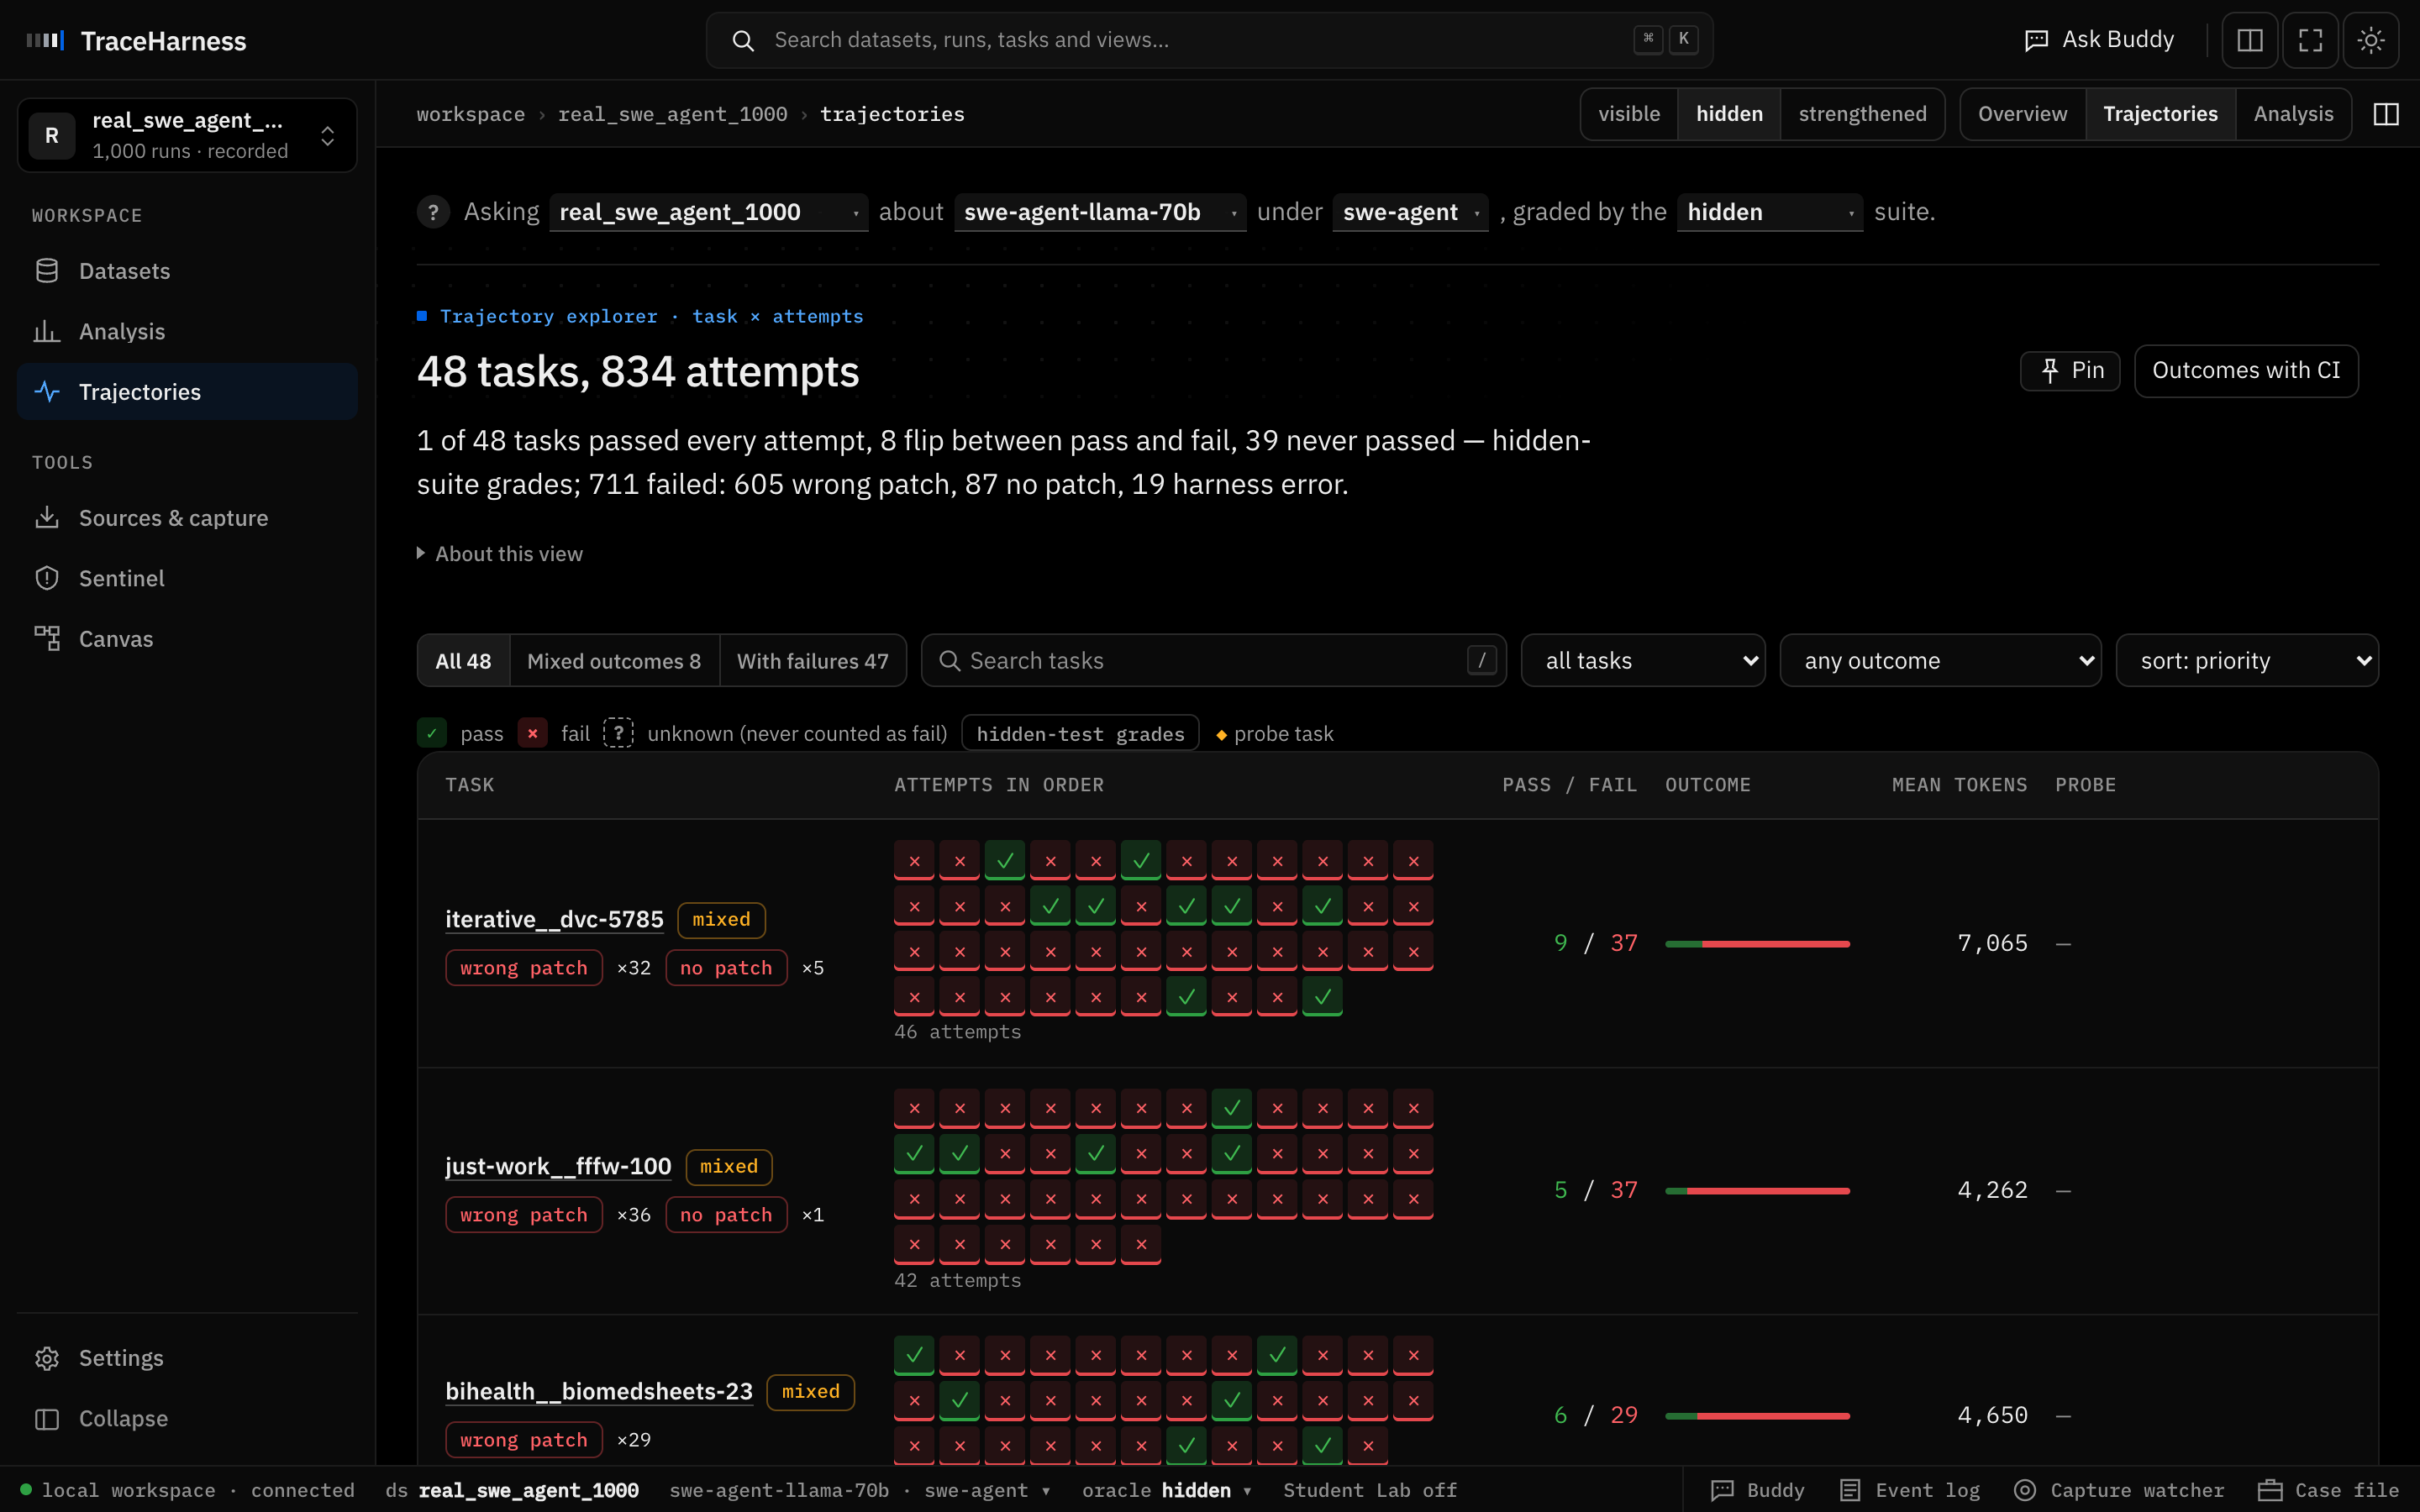
One row per task and one square per attempt, in order: ✓ resolved, × not. For llama-70b that is 48 tasks and 834 attempts:
1 task passes every time, 8 flip between pass and fail, 39 never pass. Mixed outcomes keeps the 8 tasks where the same model,
on the same issue, both succeeds and fails. That spread is run-to-run variance. iterative__dvc-5785, for example,
resolves 9 times out of 46.
TraceHarness · real_swe_agent_1000 · Trajectories
Each square opens that attempt. The chips under a task name count how its failures ended.C · Run console
Replay one trajectory, step by step
Where click any × square, or search for run real-7757-0528-iterative_dvc_5785
How it failed summarises the outcome and links to the evidence. Below it, the run console lists every step the agent took
(E edit, R read, B bash, S submit). Beside the steps is the failure risk, which Sentinel, TraceHarness's early-warning model,
recomputes after every step, and the list of detectors that fired.
In this run the agent wrote a reproduction script and ran it once, edited dvc/command/experiments.py, and submitted
without running anything again. Sentinel's submit_without_verify detector flags the submit at step 13, with the risk at 1.00.
Replay run plays the trajectory again, step by step.
TraceHarness · run real-7757-0528-iterative_dvc_5785
The run page: the verdict, how it failed, and the evidence chips that jump to the step behind each claim.The run console: 13 steps, the risk curve crossing the 0.60 threshold, and the flag Sentinel raises on the untested submit.D · Compare
Put a failed attempt next to a resolved one
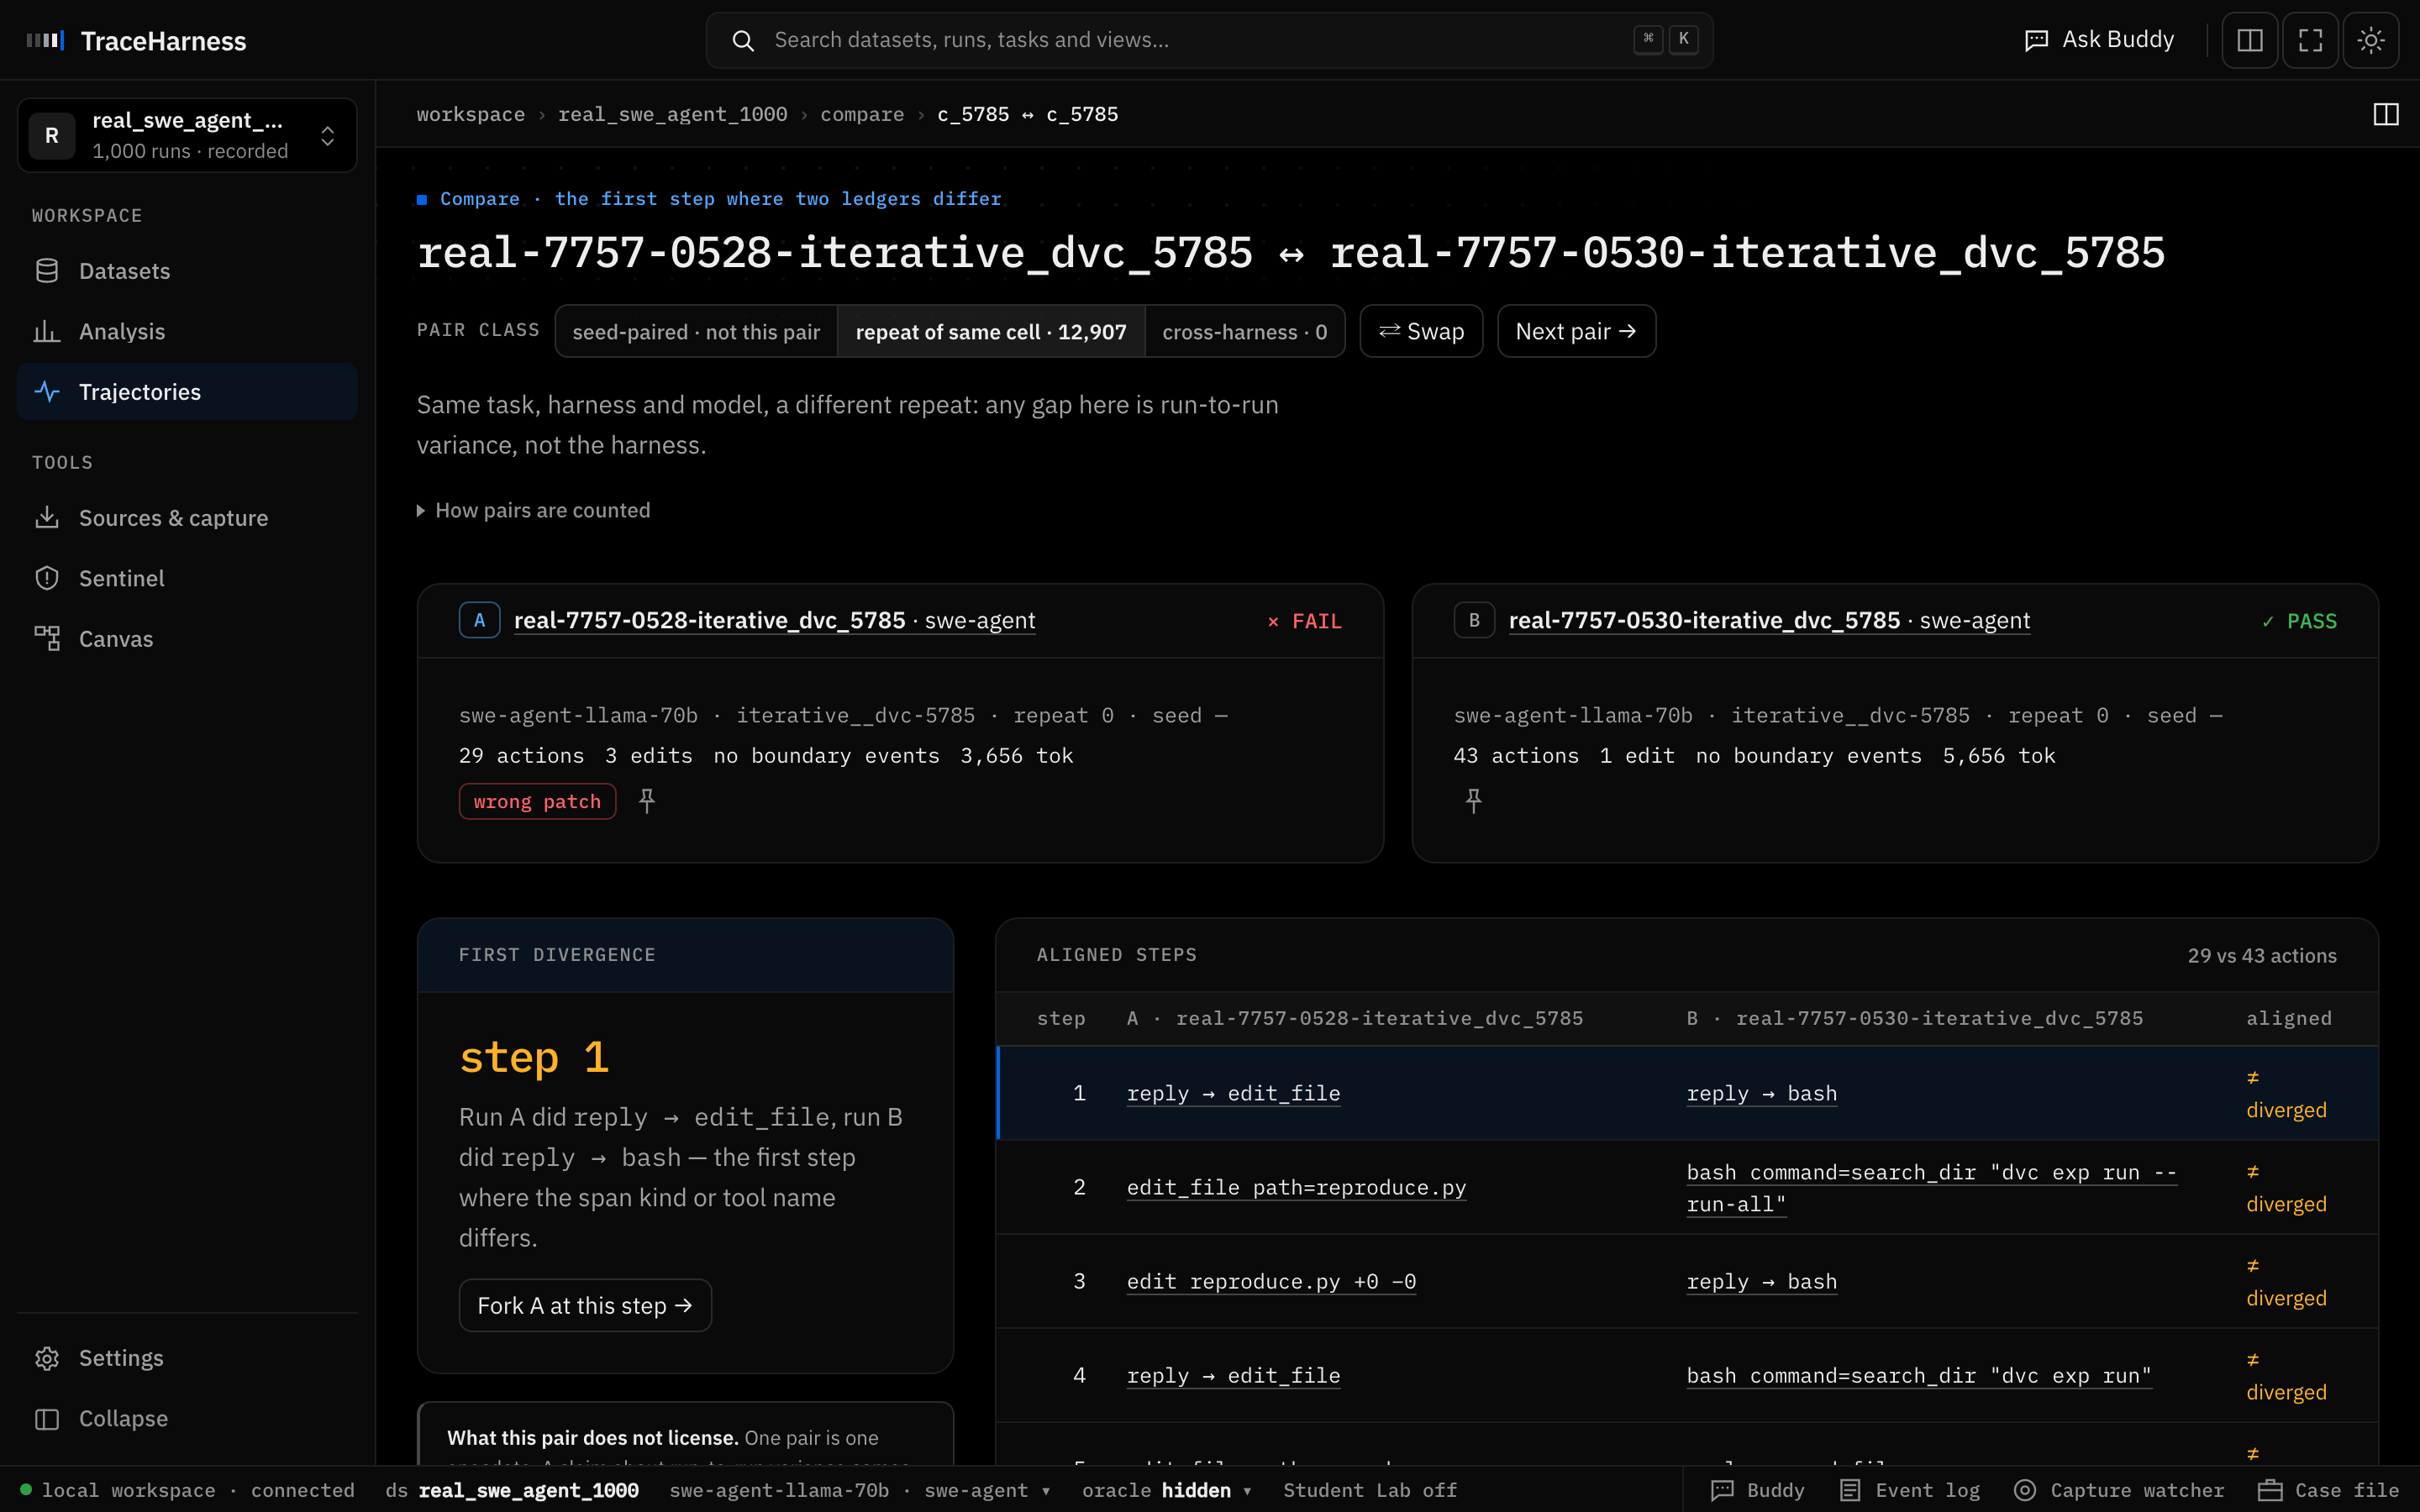
Where on the run page, Compare with real-7757-0530-iterative_dvc_5785
The comparison pairs the run with a repeat that ended differently: …0530 resolved the same issue with the same model and
harness. The view finds the first step where the two trajectories diverge, here step 1 (one edits a file, the other runs a search),
and aligns the rest. Task, model and harness are identical, so the difference is run-to-run variance, not the setup.
TraceHarness · compare
Compare: the pair class, both outcomes, the first divergence, and the aligned steps.E · Trajectory features
Find the behaviours that go with failure
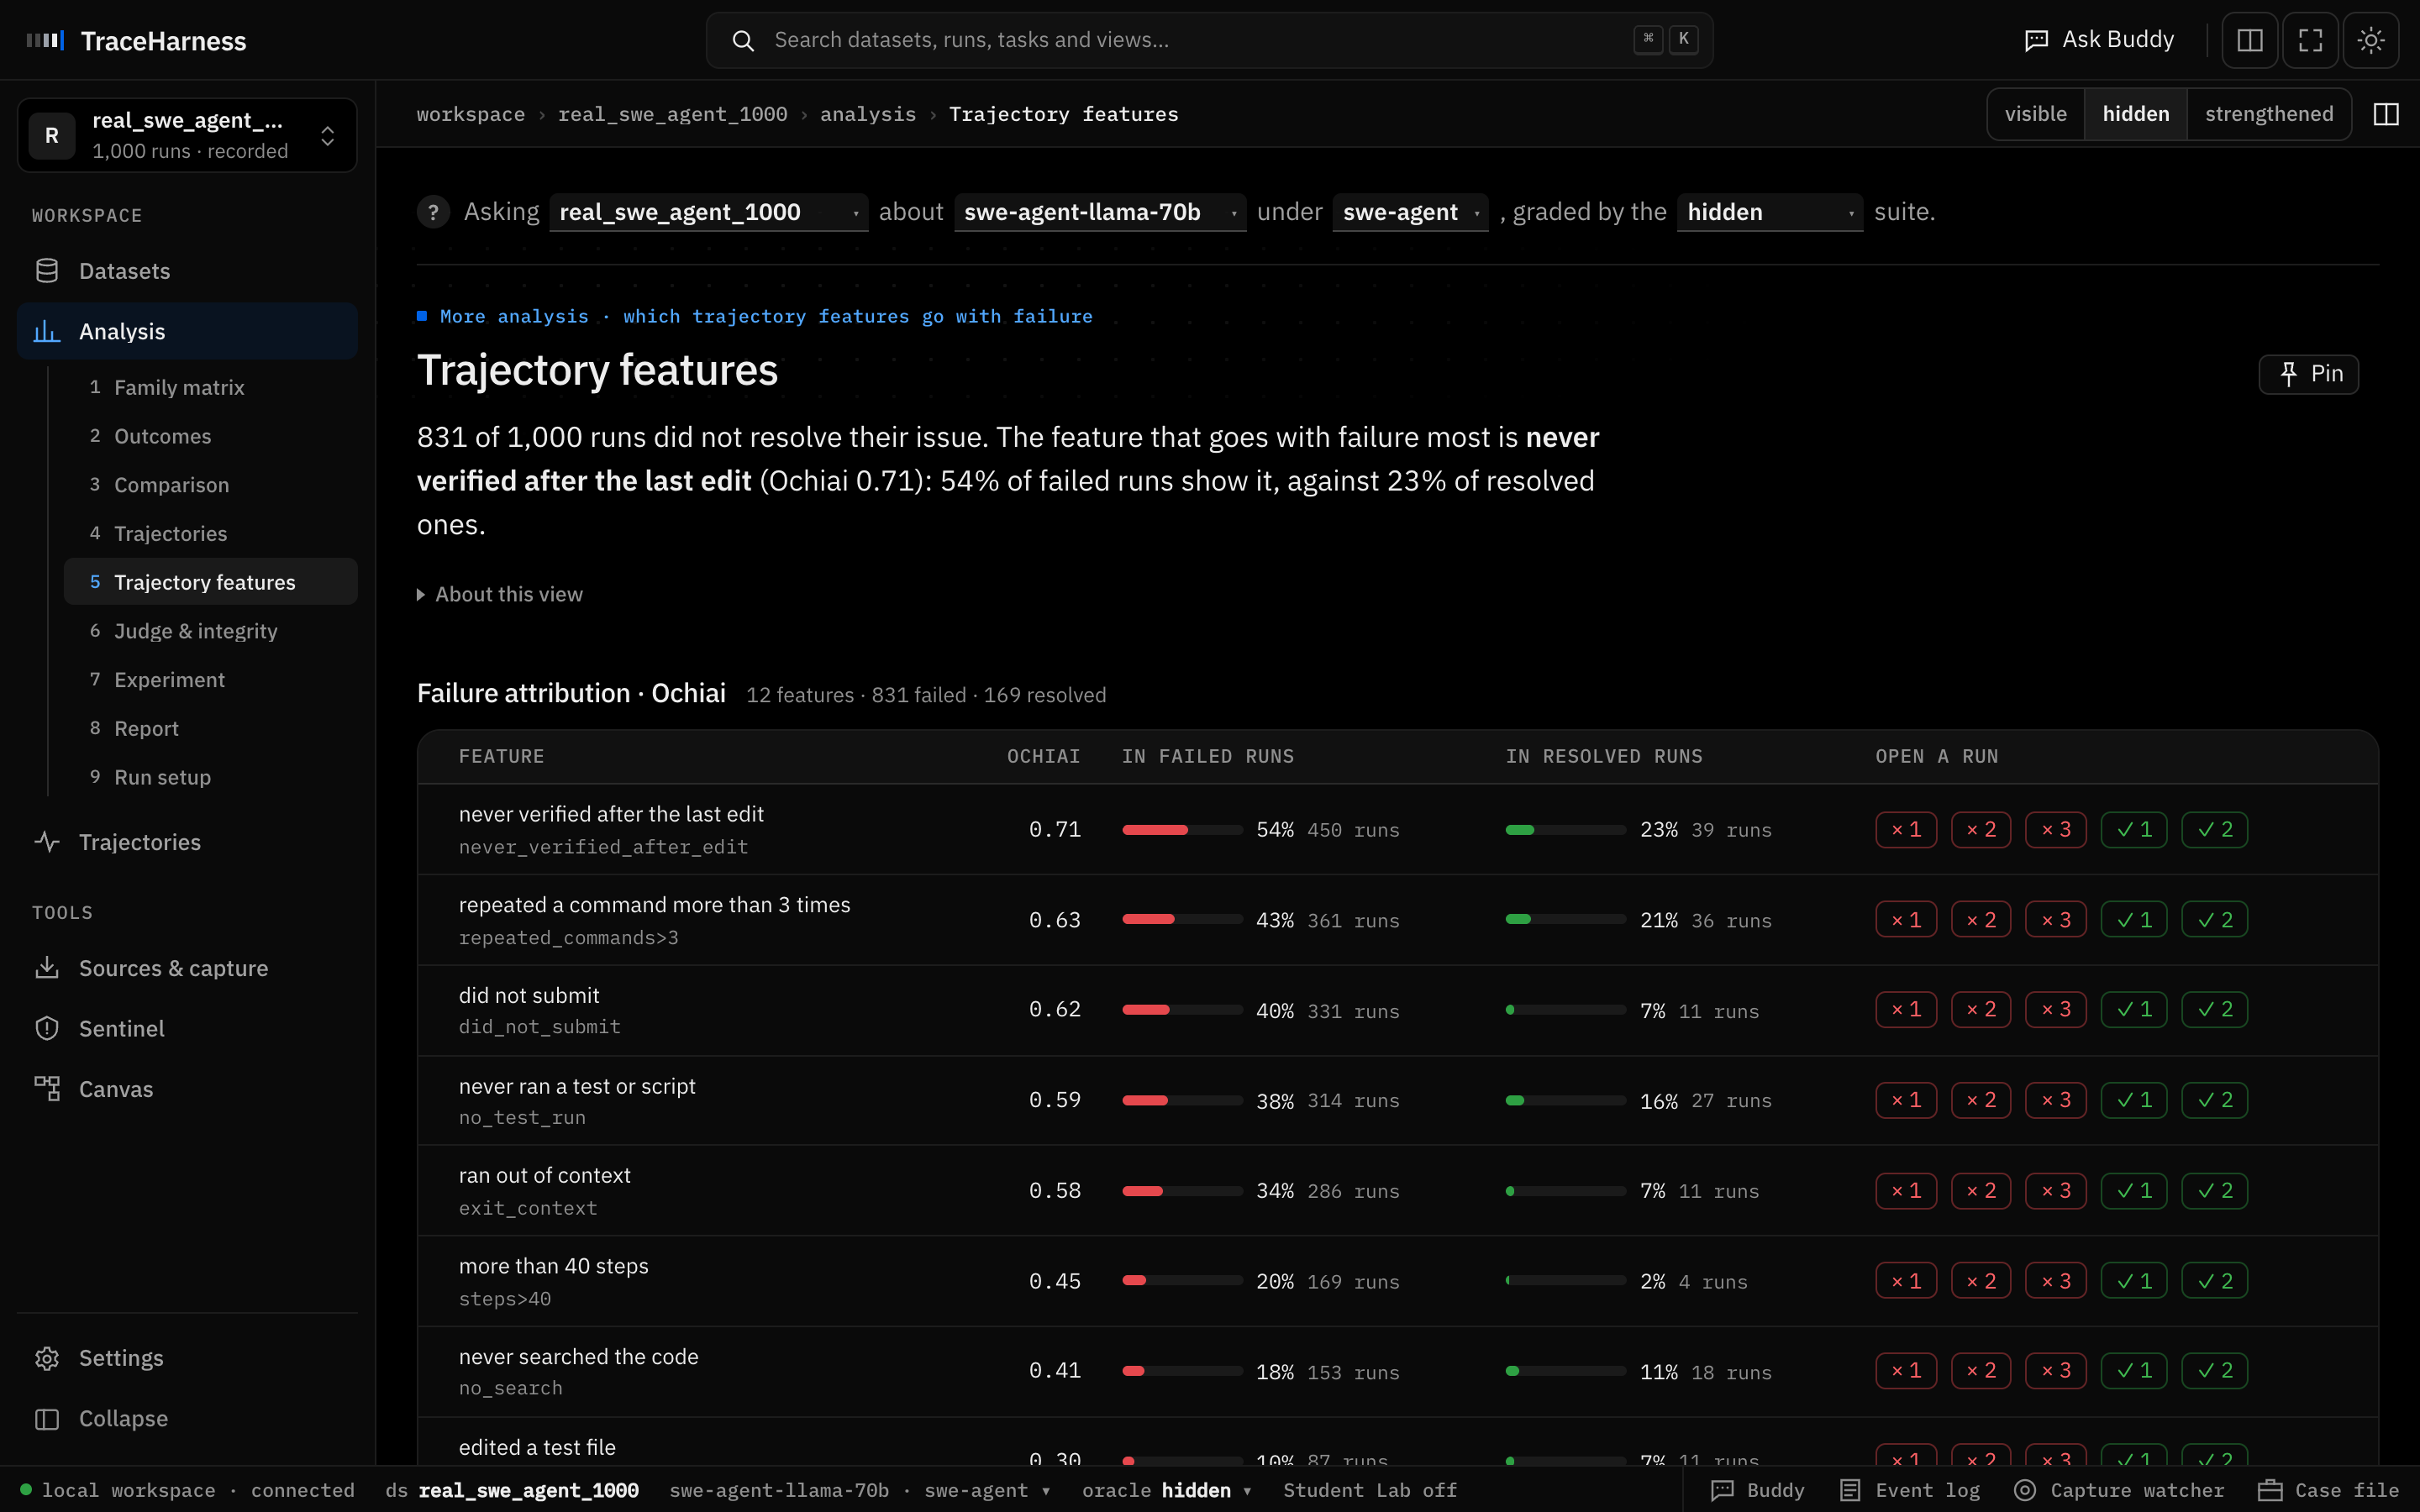
WhereAnalysis → 5 Trajectory features
Each run is described by yes/no features: never verified after the last edit, never ran a test, repeated a command more
than three times, ran out of context, and so on. Each feature gets an Ochiai score. This is spectrum-based fault
localisation with runs in place of program statements: a feature scores high when it shows up in failed runs and rarely in resolved ones.
On this sample the top feature is never verified after the last edit (Ochiai 0.71): 54% of failed runs show it, against 23% of
resolved runs. Read the two rate columns, not only the score: a feature common in every kind of run ranks high from its base rate alone.
The × and ✓ chips open example runs that have the feature.
TraceHarness · real_swe_agent_1000 · Trajectory features
The ranking, with each feature's rate in failed and in resolved runs, and example runs to open.
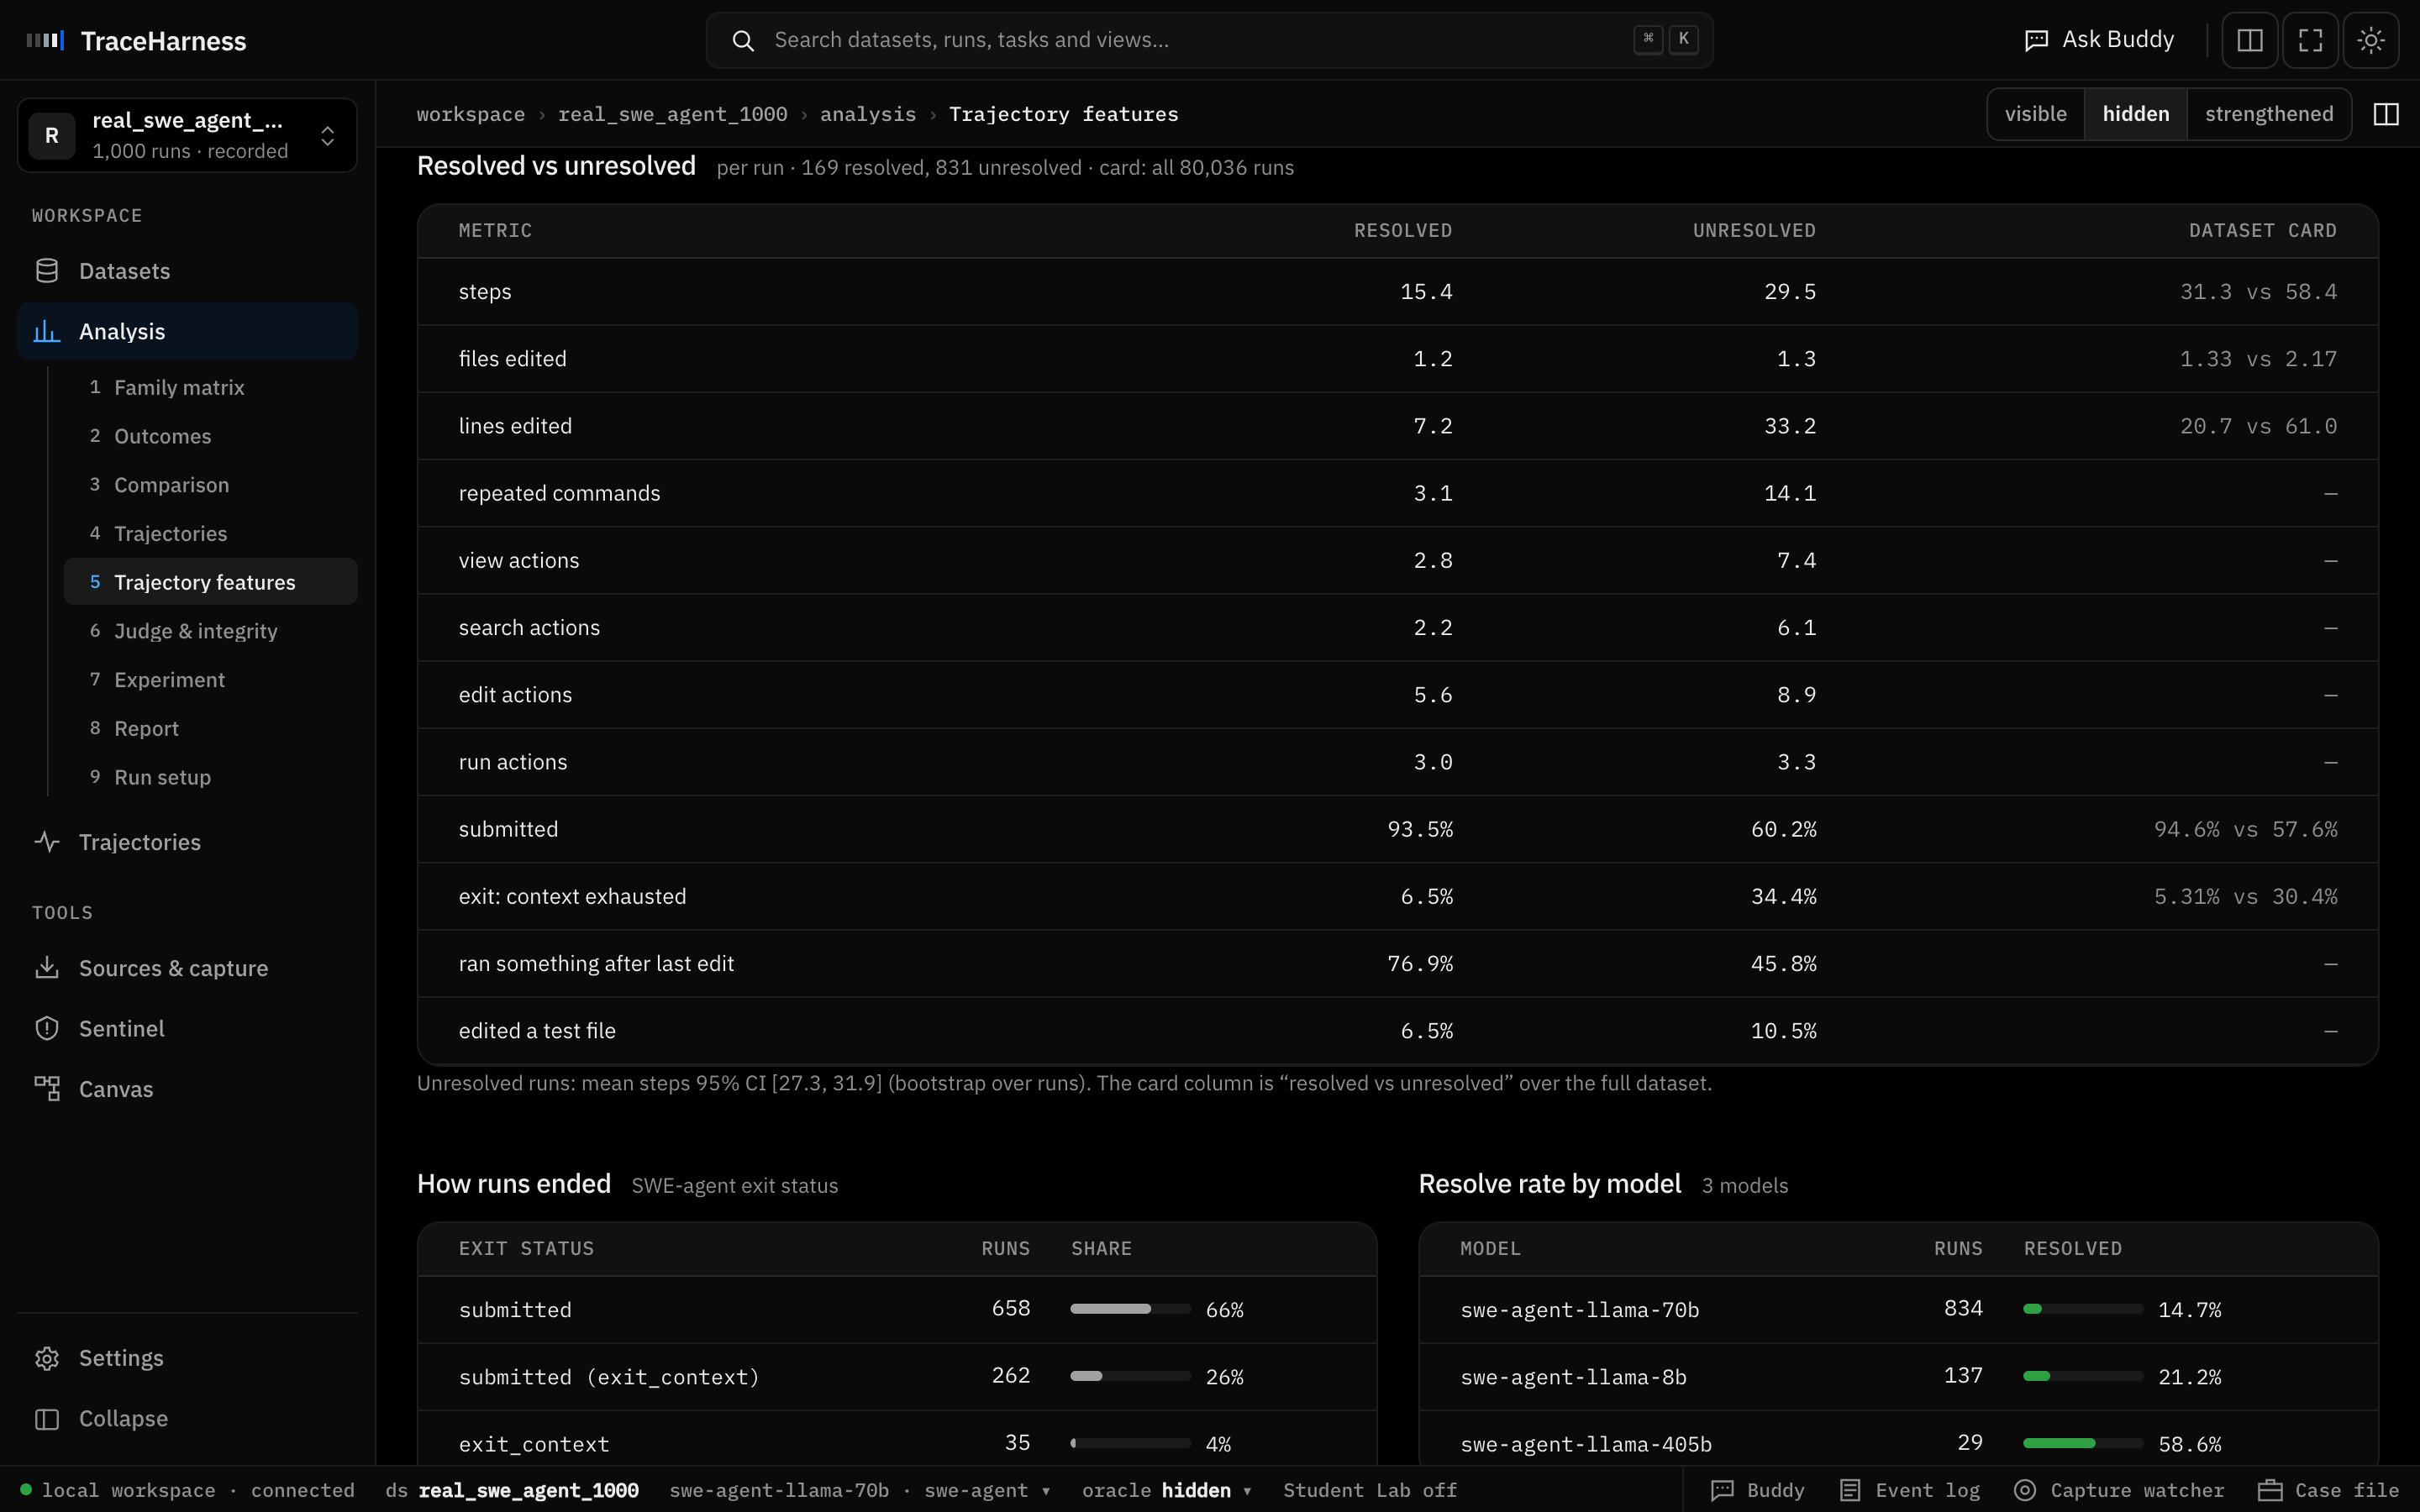
Further down the same page: resolved and unresolved runs side by side, next to the dataset card's figures for all 80,036 runs; how
runs ended; the resolve rate per model; and the action mix.
TraceHarness · real_swe_agent_1000 · Trajectory features
Unresolved runs take more steps (29.5 vs 15.4) and edit more lines (33.2 vs 7.2), as in the full dataset.F · Outcomes
Put an interval on it
WhereAnalysis → 2 Outcomes
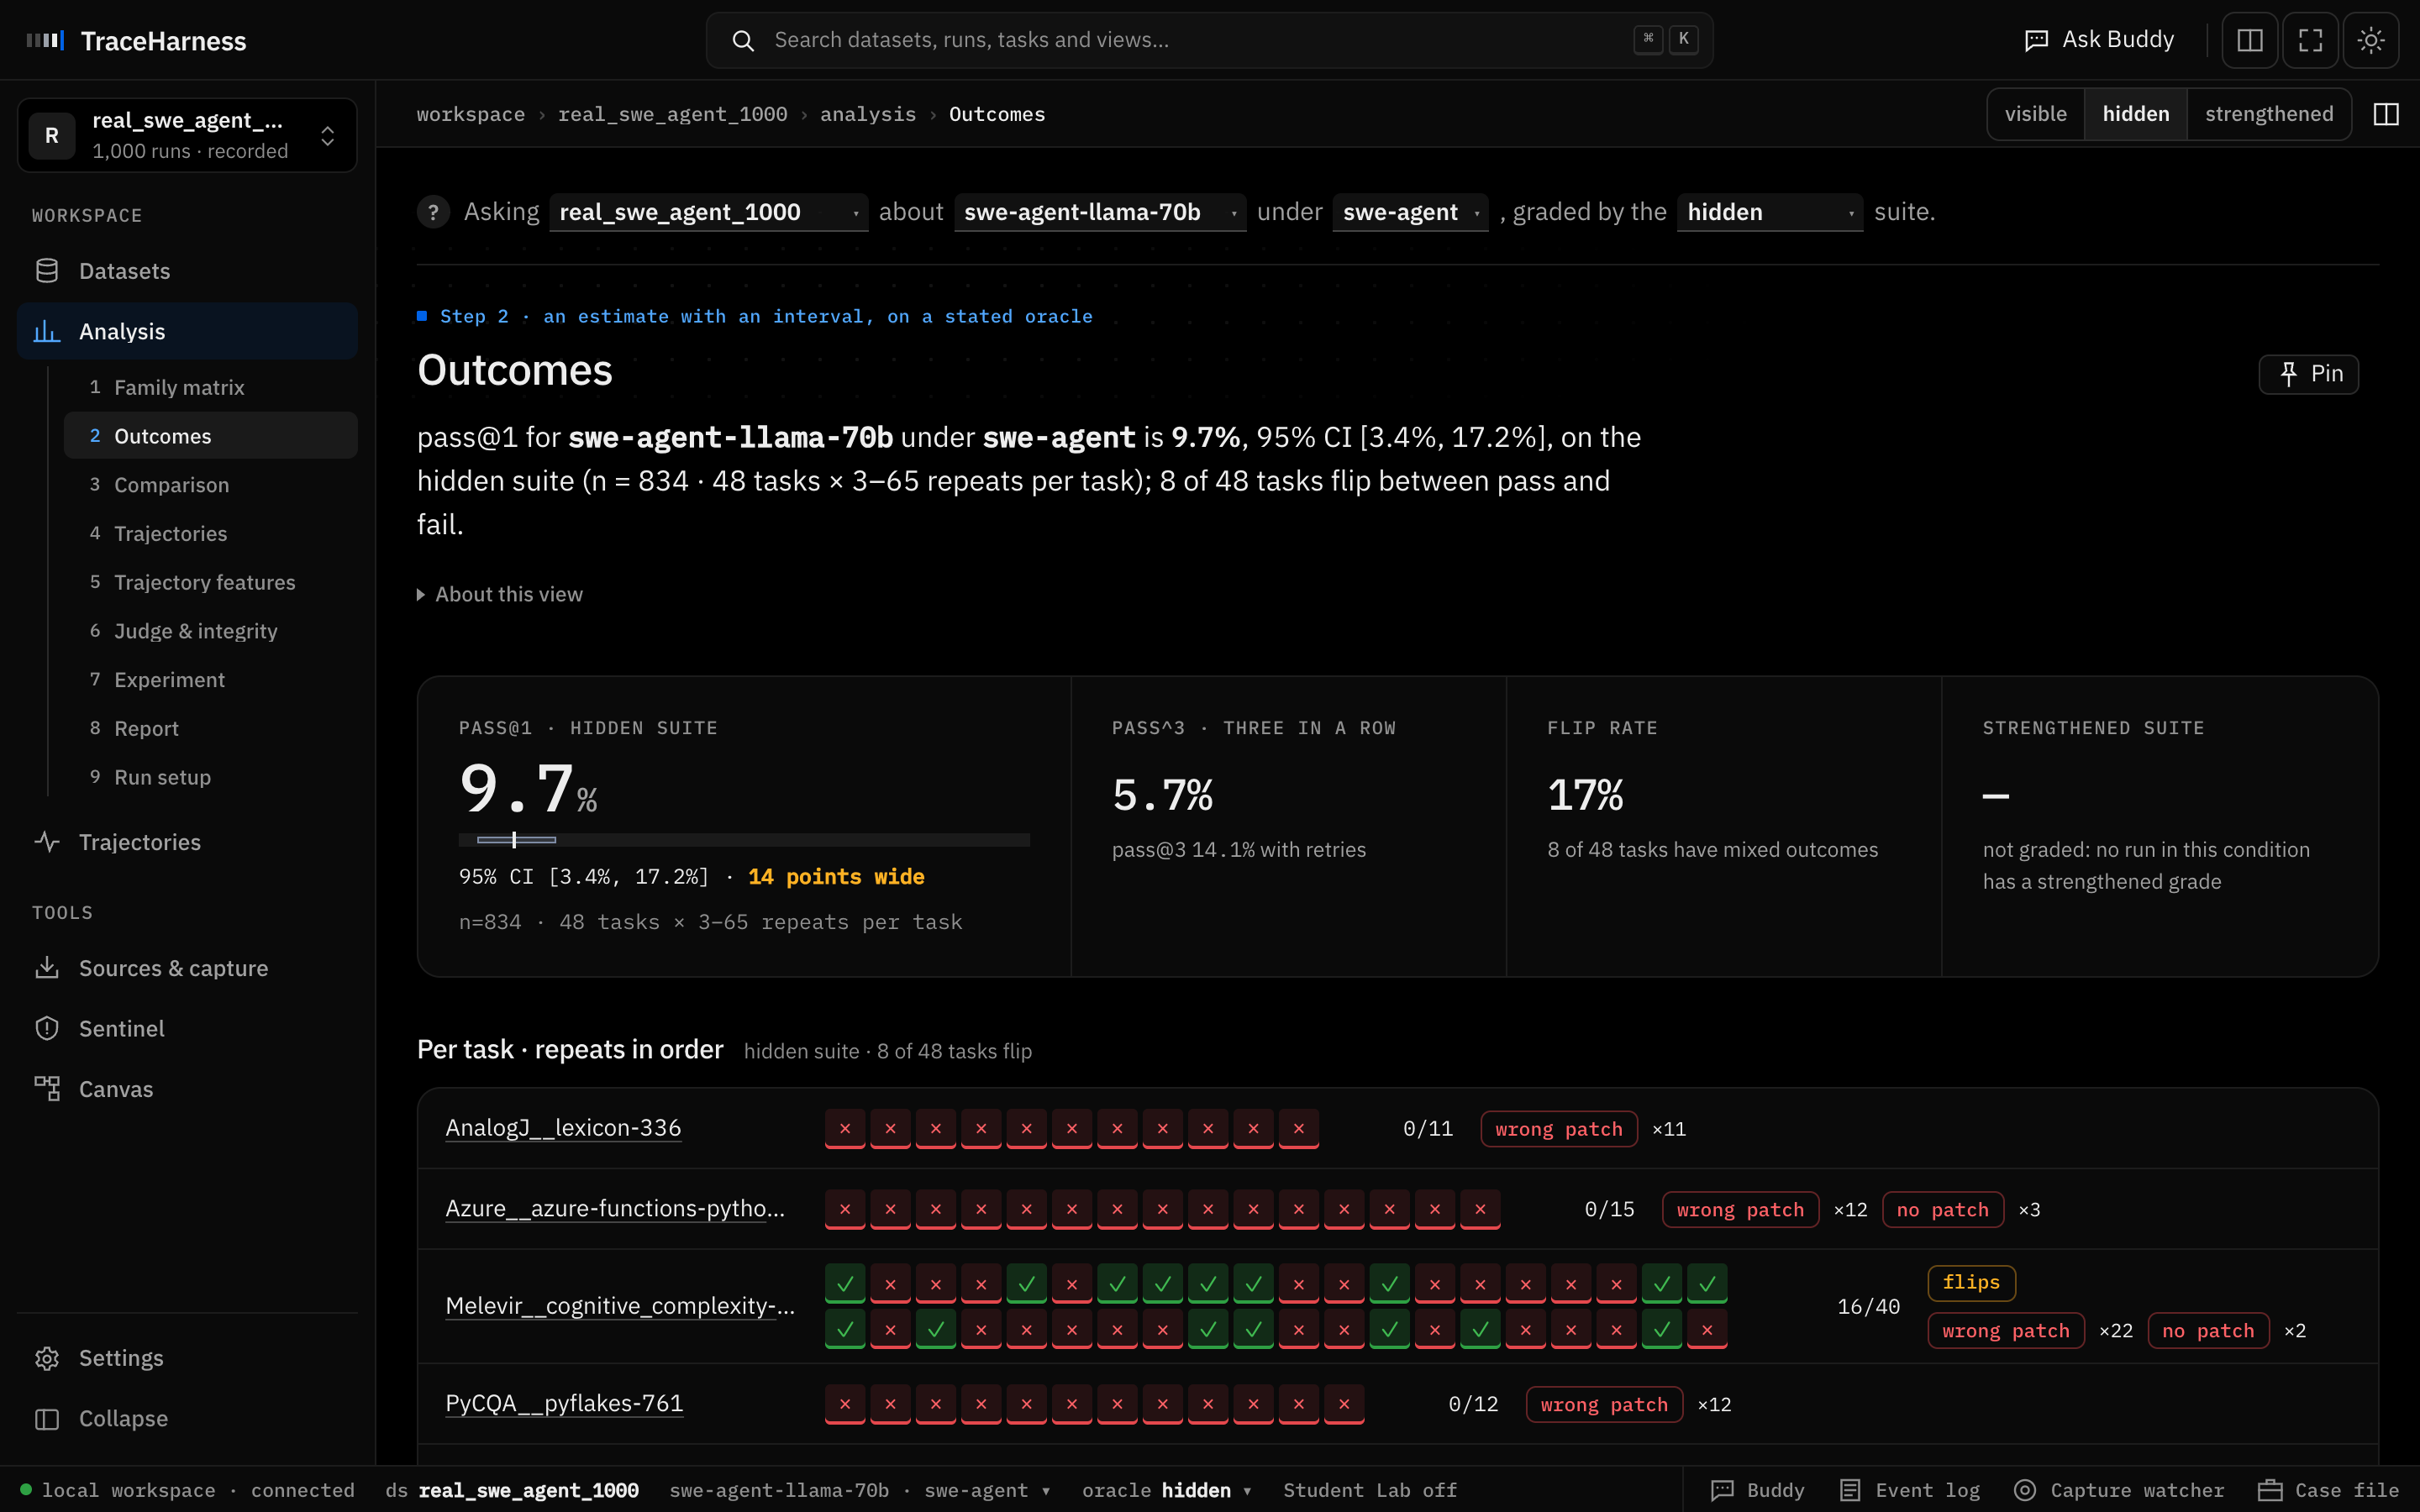
pass@1 for the condition, with a 95% confidence interval from a bootstrap over tasks. llama-70b resolves 9.7% [3.4%, 17.2%]. pass^3
(5.7%) is the chance that three attempts in a row all succeed, and the flip rate (17%) is the share of tasks with mixed outcomes.
pass@1 averages over tasks, so an issue attempted 46 times weighs as much as one attempted three times. That is why it differs from the
pooled 14.7% of llama-70b runs resolved in Trajectory features. Change the model in the Asking line to compare models:
llama-405b reaches 57.6%, but from 29 runs, with an interval from 28.6% to 86.7%.
TraceHarness · real_swe_agent_1000 · Outcomes
Outcomes for swe-agent-llama-70b, then every task's attempts in order.G · Report
Write it up
WhereAnalysis → 8 Report
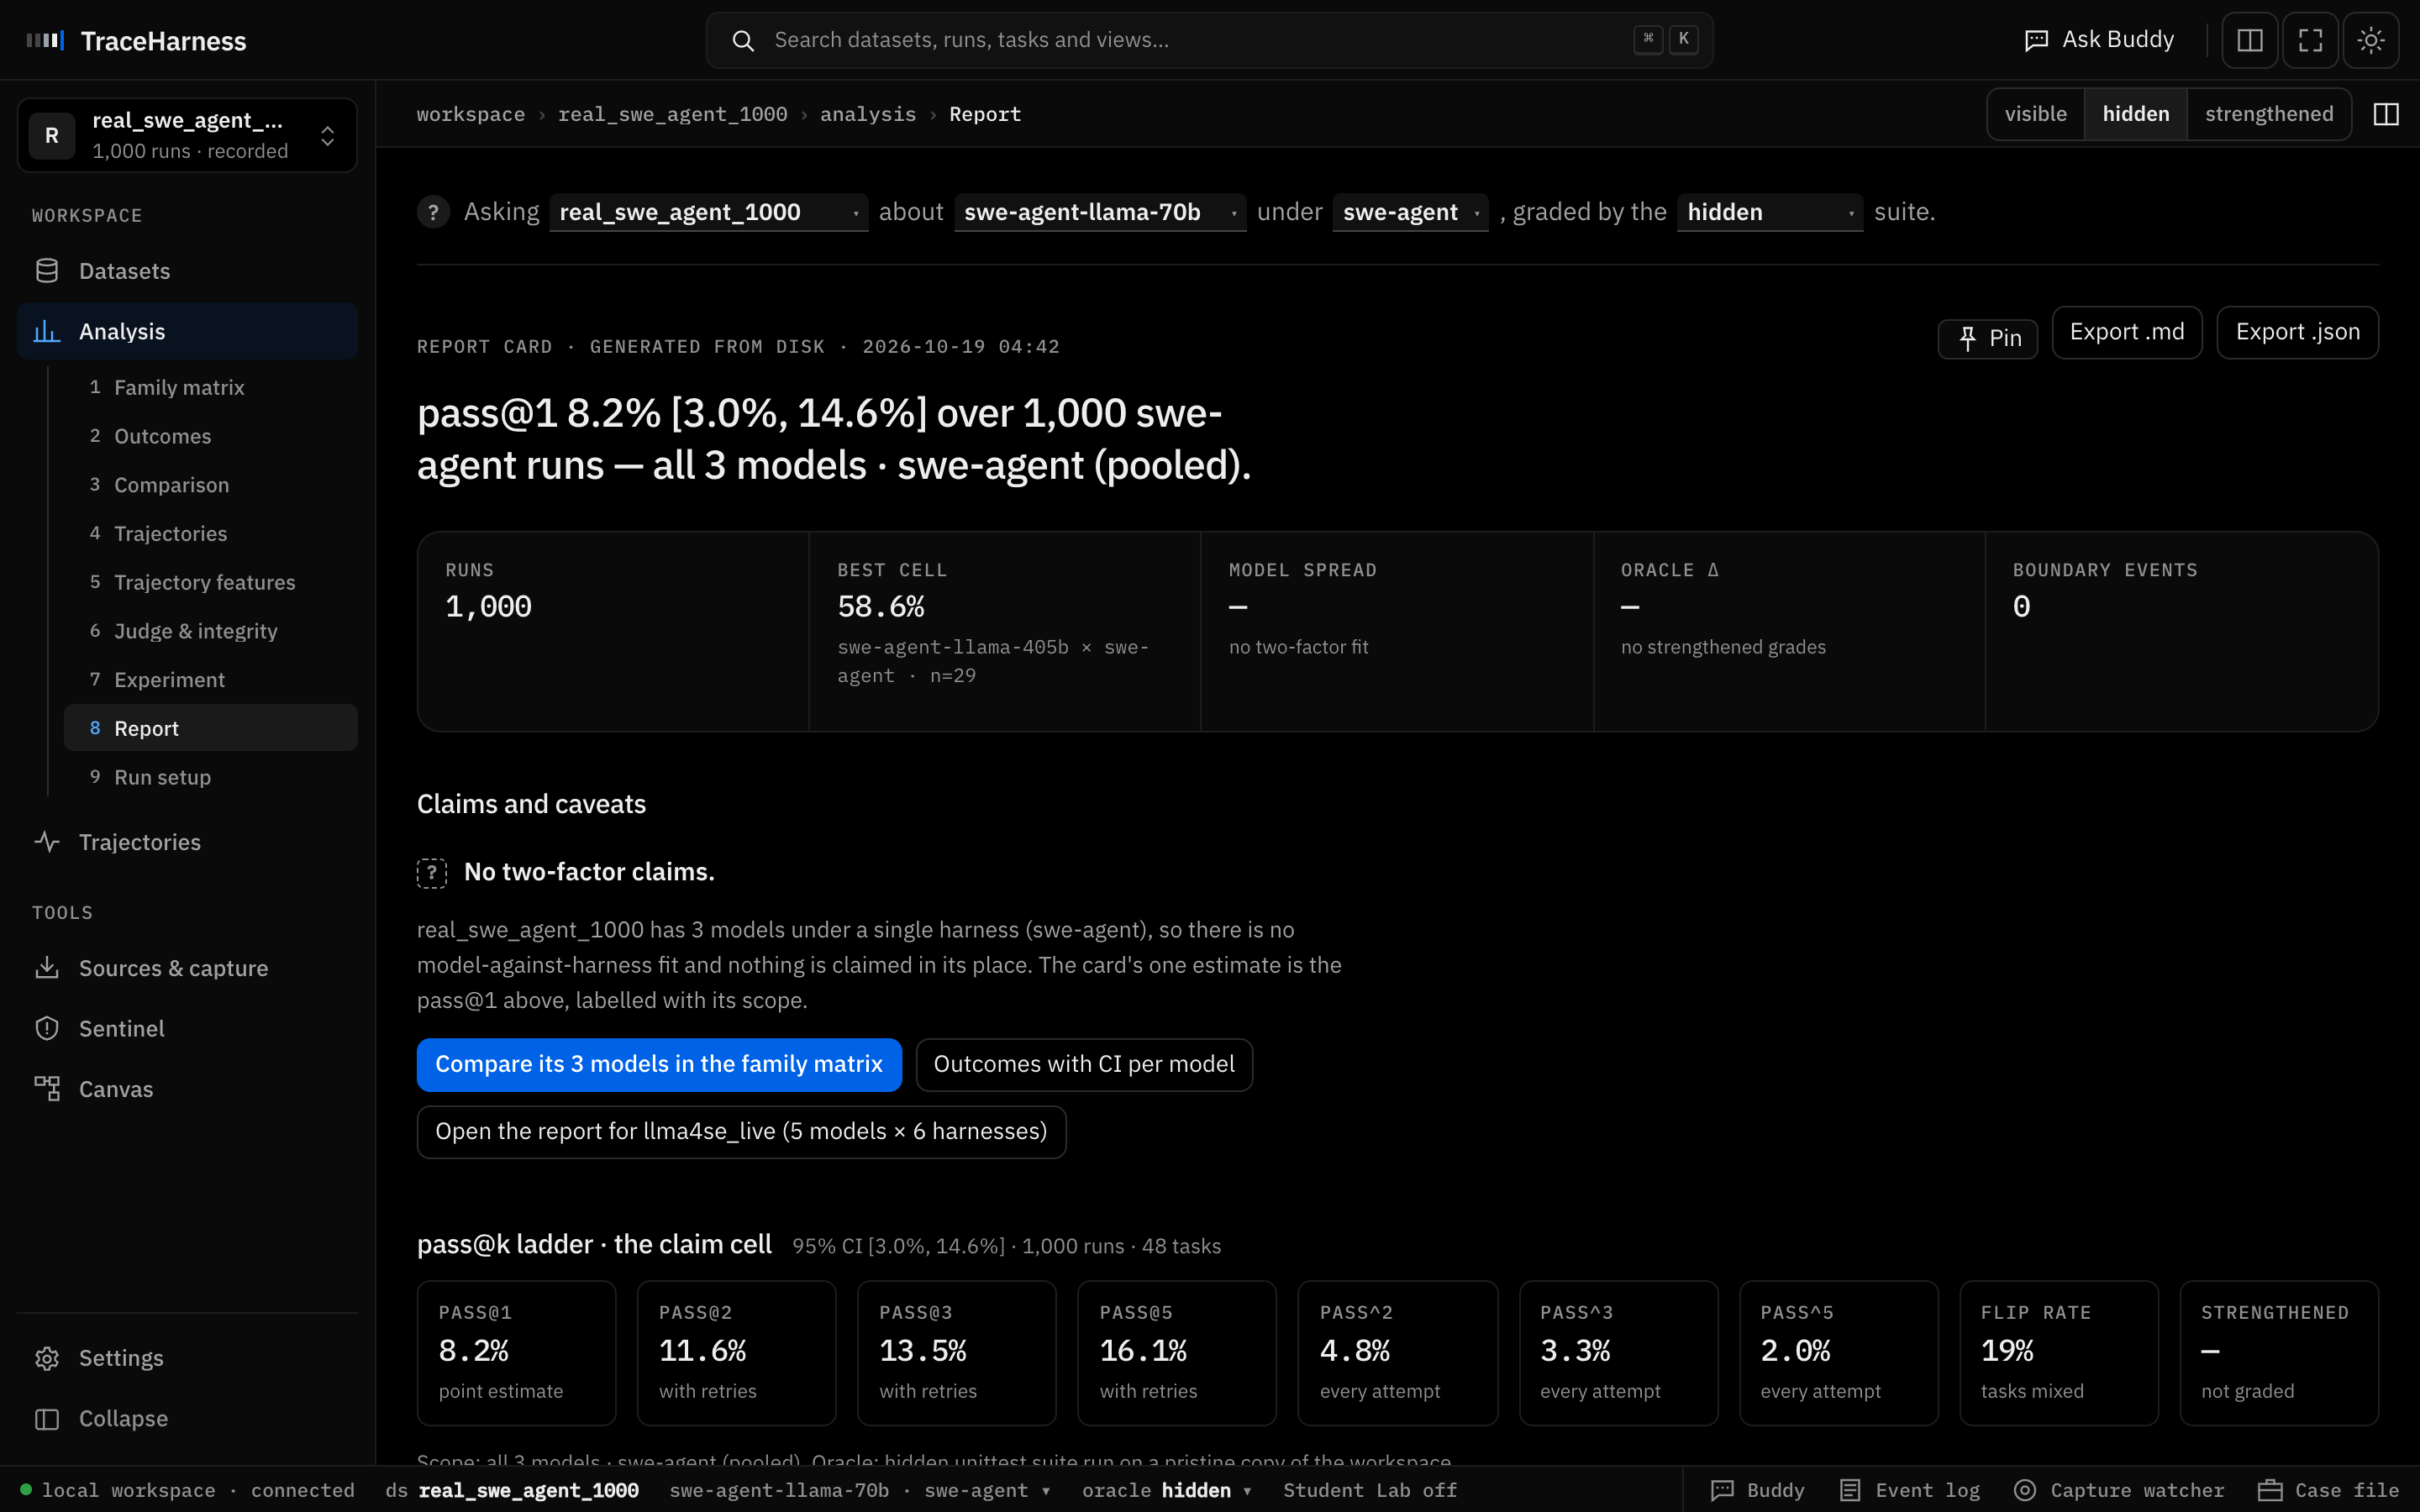
The report card states the estimate with its interval and its scope, the claims the data supports, and the caveats. Export .md
downloads it for your hand-in. As you work, Pin any figure or run to the Case file (bottom right) to keep your evidence together.
TraceHarness · real_swe_agent_1000 · Report
The report card for the whole sample, all three models pooled.
Shortcut
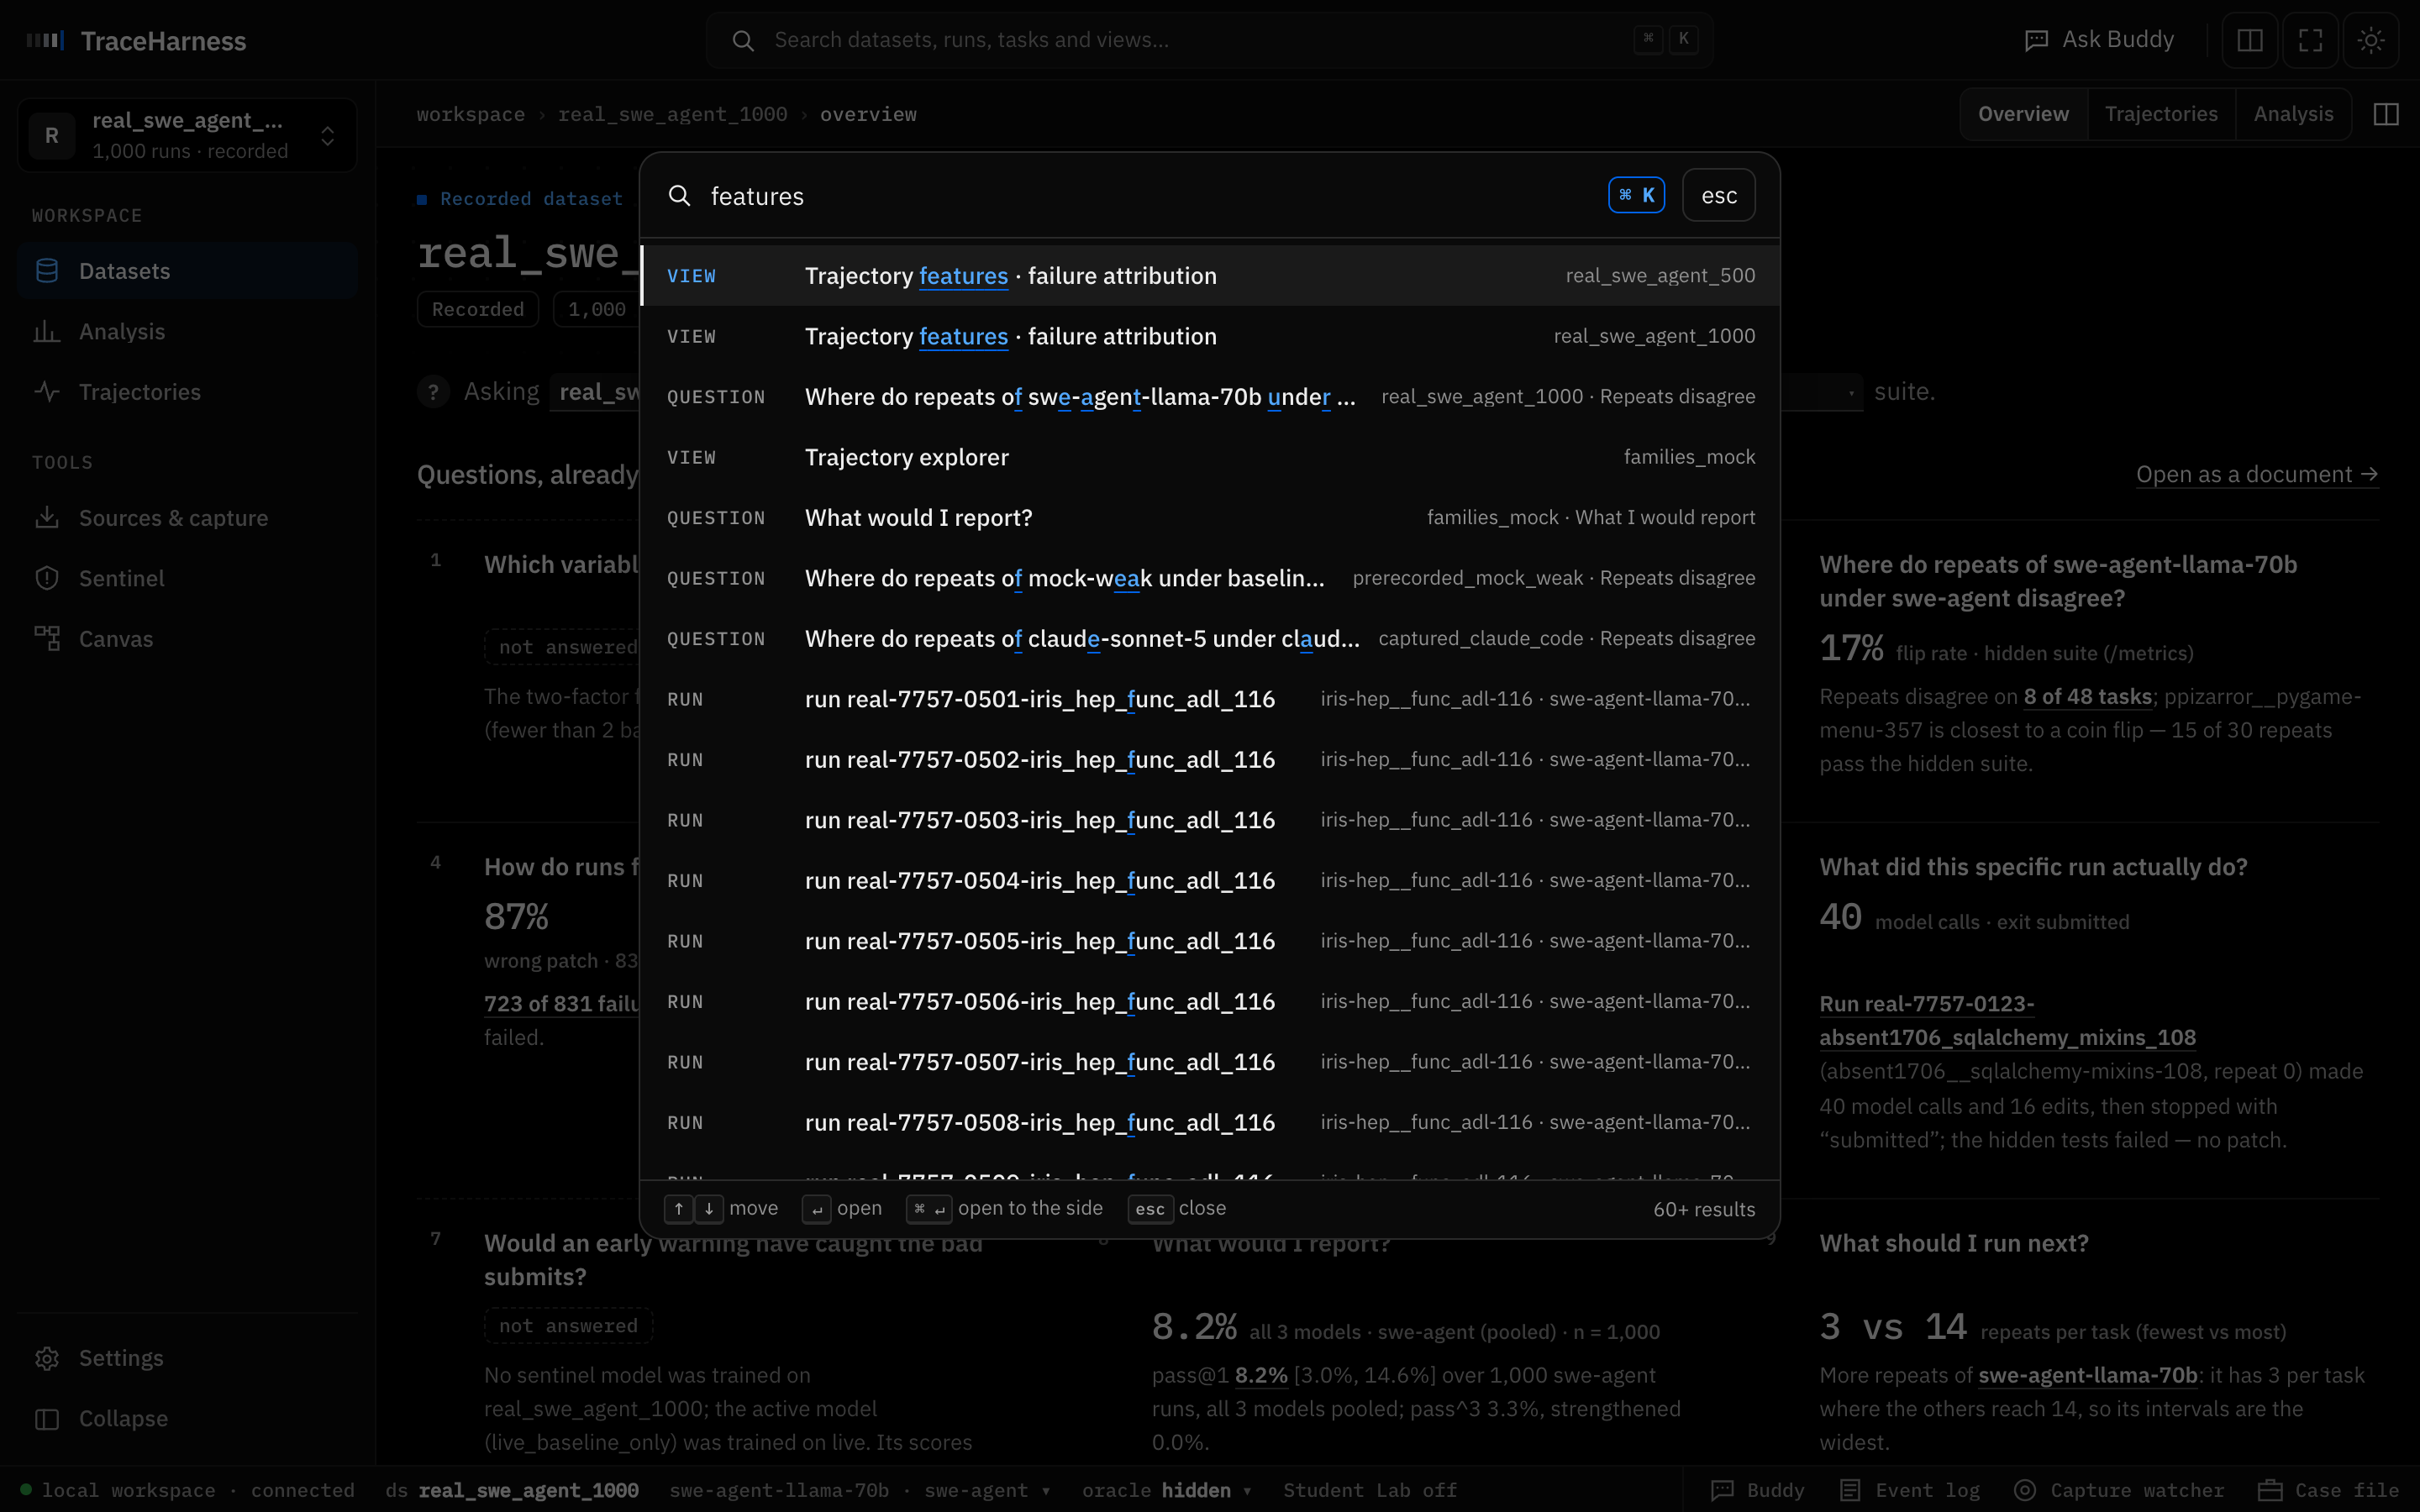
Press ⌘K (CtrlK on Windows and Linux) to search
datasets, runs, tasks and views from anywhere.
TraceHarness · search
Type a few letters of a view, run id or task to jump straight to it.
Part 04 · Explore
Questions to explore
Each one can be answered in TraceHarness. Note the ids of the runs you open, so someone else can follow the same evidence.
Cause or symptom?
Never verified after the last edit tops the ranking. Open two failed runs and one resolved run from its row. Is the
feature a cause of failure, a symptom of an agent that is already lost, or an artefact of how SWE-agent was run? Argue from the trajectories.
Base rates
Did not submit scores 0.62 with rates of 40% and 7%. Repeated a command more than three times scores 0.63 with
43% and 21%. Which one separates failed from resolved runs better, and why does Ochiai rank them almost level?
Is the bigger model better?
llama-405b reaches 57.6% pass@1 against llama-70b's 9.7%. Check how many runs and which tasks each model has
(Family matrix, Outcomes). What would you need before claiming that 405B is the better agent?
Same agent, different outcome
Pick a task with mixed outcomes in the explorer and compare a failed attempt with a resolved one. Where do they
first diverge? Does that step explain the outcome?
Would an early warning help?
In run …0528 Sentinel flags the submit at step 13. If the harness had blocked that submit and told the
agent to run the tests, would the run have resolved its issue? What does a false alarm cost?
Keep it
Pin what you find to the Case file, and share the report card with Export .md.
Part 05 · Help
Troubleshooting
The download fails or never starts
The server has to reach huggingface.co. Click Retry the download. If the network is blocked, use real_swe_agent_500, which is already in your workspace.
It says data/runs/real_swe_agent_1000 already exists
You loaded it before. The form then picks a free name (real_swe_agent_1000_2) and says so. You can also type your own name under Results directory.
My numbers differ from this guide
They match when you load 1,000 runs with Model and Results directory blank, and grade on the hidden suite (the selector at the top right). Another run count or a model filter gives a different sample.
TraceHarness stopped responding
Start it again with python -m harnesslab (a codespace that went idle restarts it when you reopen it). Your datasets under data/runs/ are kept.
Where are the files?
data/runs/real_swe_agent_1000/ holds one folder per run (ledger.jsonl with every step, summary.json, patch.diff, messages.json), plus index.jsonl and real_features.jsonl.
The downloaded file is cached in ~/.cache/harnesslab/nebius/, so a second download skips the network.